|

USD/CHF Price Analysis: 50-DMA challenges bulls around 0.9750

  • USD/CHF remains on the front foot at the highest levels in three weeks.
  • Firmer RSI, sustained break of 20-DMA suggests further upside momentum towards two-month-old horizontal resistance.
  • Bears need to stay cautious unless breaking 100-DMA.

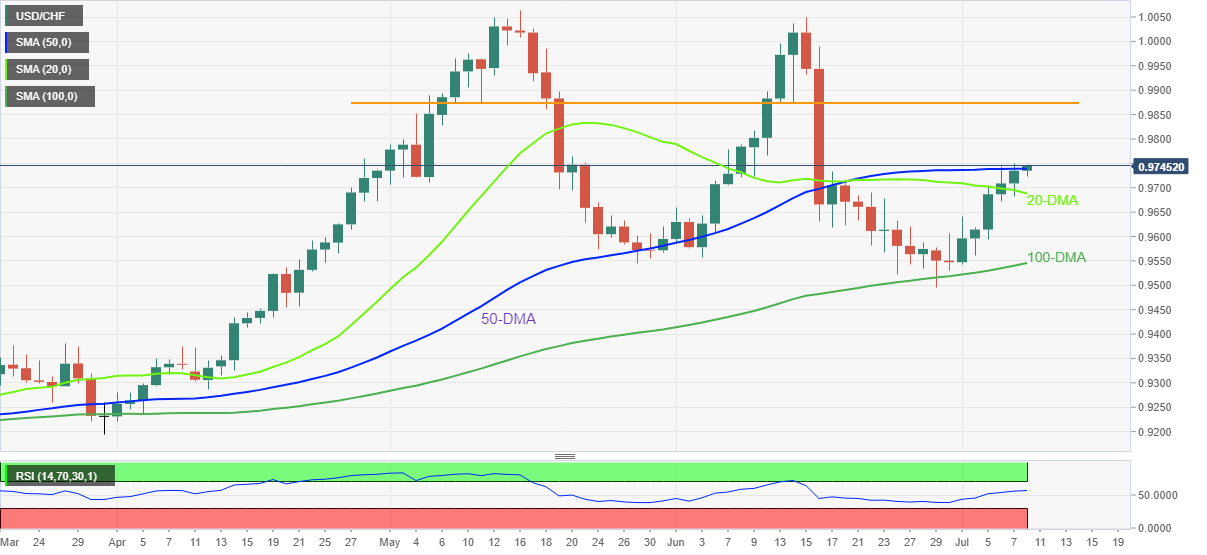
USD/CHF stays firmer for the sixth consecutive day, taking rounds to 0.9740-45 during early Friday morning in Europe. In doing so, the Swiss currency (CHF) pair remains near the highest levels since mid-June while poking the 50-DMA for the third day in a row.

Although the quote failed to cross the key DMA hurdle two times during the week, the bulls are likely to win the latest battle as the quote remains firmer past 20-DMA and the RSI (14) also grinds higher.

Following that, the USD/CHF prices could rally to the early May swing high near 0.9800 before challenging the two-month-old horizontal resistance, near 0.9870.

It should be noted, however, that the pair’s run-up beyond 0.9870 enables the buyers to challenge the yearly top marked in May at around 1.0065. During the rise, the 1.0000 psychological magnet could probe the bulls.

Meanwhile, pullback moves remain elusive until staying beyond the 20-DMA level of 0.9688.

Should the USD/CHF bears manage to conquer the 20-DMA support, a downward trajectory towards the 100-DMA support of 0.9545 can’t be ruled out. Also challenging the pair’s downside is June’s low around 0.9495.

USD/CHF: Daily chart

Trend: Further upside expected

Additional important levels

Overview
Today last price0.9745
Today Daily Change0.0010
Today Daily Change %0.10%
Today daily open0.9735
 
Trends
Daily SMA200.9695
Daily SMA500.9739
Daily SMA1000.954
Daily SMA2000.9377
 
Levels
Previous Daily High0.9749
Previous Daily Low0.9682
Previous Weekly High0.9642
Previous Weekly Low0.9495
Previous Monthly High1.005
Previous Monthly Low0.9495
Daily Fibonacci 38.2%0.9723
Daily Fibonacci 61.8%0.9707
Daily Pivot Point S10.9695
Daily Pivot Point S20.9655
Daily Pivot Point S30.9628
Daily Pivot Point R10.9762
Daily Pivot Point R20.9789
Daily Pivot Point R30.9829

Author

Anil Panchal

Anil Panchal

FXStreet

Anil Panchal has nearly 15 years of experience in tracking financial markets. With a keen interest in macroeconomics, Anil aptly tracks global news/updates and stays well-informed about the global financial moves and their implications.

More from Anil Panchal
Share:

Editor's Picks

EUR/USD accelerates losses, focus is on 1.1800

EUR/USD’s selling pressure is gathering pace now, opening the door to a potential test of the key 1.1800 region sooner rather than later. The pair’s pullback comes on the back of marked gains in the US Dollar following US data releases and the publication of the FOMC Minutes later in the day.

GBP/USD turns negative near 1.3540

GBP/USD reverses its initial upside momentum and is now adding to previous declines, revisiting at the same time the 1.3540 region on Wednesday. Cable’s downtick comes on the back of decent gains in the Greenback and easing UK inflation figures, which seem to have reinforced the case for a BoE rate cut in March.

Gold picks pace, flirts with $5,000

Gold is back on the front foot on Wednesday, shaking off part of the early week softness and pushing higher towards the key $5,000 mark per troy ounce. The move comes ahead of the FOMC Minutes and is unfolding despite an intense rebound in the US Dollar.

Fed Minutes to shed light on January hold decision amid hawkish rate outlook

The Minutes of the Fed’s January 27-28 monetary policy meeting will be published today. Details of discussions on the decision to leave the policy rate unchanged will be scrutinized by investors.

Mixed UK inflation data no gamechanger for the Bank of England

Food inflation plunged in January, but service sector price pressure is proving stickier. We continue to expect Bank of England rate cuts in March and June. The latest UK inflation read is a mixed bag for the Bank of England, but we doubt it drastically changes the odds of a March rate cut.

Sui extends sideways action ahead of Grayscale’s GSUI ETF launch

Sui is extending its downtrend for the second consecutive day, trading at 0.95 at the time of writing on Wednesday. The Layer-1 token is down over 16% in February and approximately 34% from the start of the year, aligning with the overall bearish sentiment across the crypto market.