|

USD/CHF pares some weekly losses, hovers around 0.9150

  • USD/CHF bounces off 0.9099 amid risk-off market sentiment.
  • The US Dollar Index rises in the day, despite falling US T-bond yields.
  • The USD/CHF 4-hour chart shows the pair is within a bullish flag, but a break below 0.9100 could invalidate the chart pattern.

The USD/CHF trims some weekly losses, advances sharply during the New York session, up 0.61%, trading at 0.9171 at the time of writing. Comments of some US CEOs about supply shortages, and higher costs amid companies missing earnings expectations, dampened the market sentiment. Additionally, inflationary pressures and central bank tightening monetary conditions kept investors at bay

Earlier in the day, the USD/CHF printed a weekly low of around 0.9099. But once American traders got to their desks, the pair jumped almost 70 pips, due in part to month-end flows and US dollar demand.

In the meantime, the US Dollar Index is rising almost 1%, sitting at 94.28 amid falling US T-bond yields. The US 10-year Treasury yield is flat, currently at 1.568%.

On the macroeconomic front, the US Personal Consumption expenditures, the Fed’s preferred inflation gauge, surged 3.6% year-on-year in September, a tad lower than expectations but in line with the August figure, signaling that inflation is stabilizing after a sudden jump to 6.1%.

USD/CHF Price Forecast: Technical outlook

4-hour chart

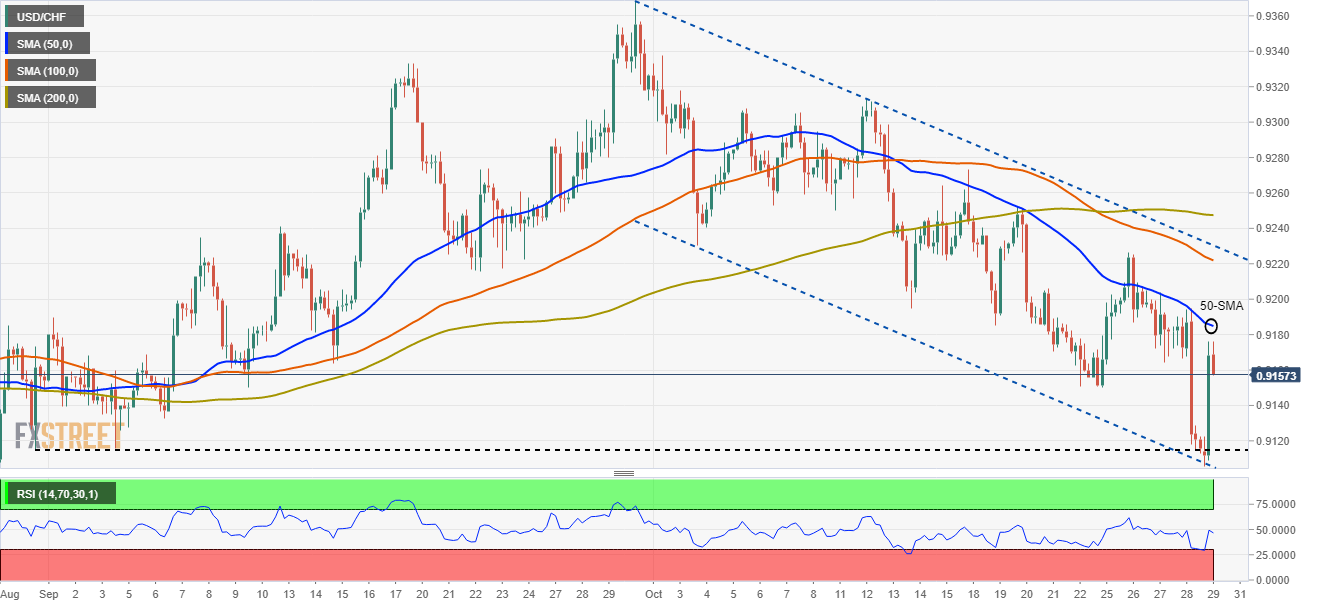
The USD/CHF pair is in a downtrend, shown by the simple moving averages (SMA’s) located above the spot price. Furthermore, a descending channel that seems to be a bullish flag capped the last downward move, bouncing off the bottom of the channel, towards the 50-simple moving average at 0.9181.

Nevertheless, the Relative Strength Index (RSI) at 48 is seesawing up and down, showing no clear confirmation of the actual trend.

If USD/CHF buyers fail to gain traction above 0.9200, investors could expect a renewed re-test of the daily lows around 0.9099.

USD/CHF TECHNICAL LEVELS TO WATCH

Overview
Today last price0.9158
Today Daily Change0.0040
Today Daily Change %0.44
Today daily open0.9118
 
Trends
Daily SMA200.9233
Daily SMA500.9218
Daily SMA1000.9187
Daily SMA2000.9148
 
Levels
Previous Daily High0.9195
Previous Daily Low0.9115
Previous Weekly High0.9273
Previous Weekly Low0.9151
Previous Monthly High0.9368
Previous Monthly Low0.9116
Daily Fibonacci 38.2%0.9146
Daily Fibonacci 61.8%0.9164
Daily Pivot Point S10.9091
Daily Pivot Point S20.9063
Daily Pivot Point S30.9011
Daily Pivot Point R10.917
Daily Pivot Point R20.9222
Daily Pivot Point R30.925


Author

Christian Borjon Valencia

Christian Borjon began his career as a retail trader in 2010, mainly focused on technical analysis and strategies around it. He started as a swing trader, as he used to work in another industry unrelated to the financial markets.

More from Christian Borjon Valencia
Share:

Markets move fast. We move first.

Orange Juice Newsletter brings you expert driven insights - not headlines. Every day on your inbox.

By subscribing you agree to our Terms and conditions.

Editor's Picks

EUR/USD trades around 1.1700 after rebounding from 50-day EMA

EUR/USD gains ground after three days of losses, trading around 1.1700 during the Asian hours on Wednesday. On the daily chart, technical analysis indicates a potential for a bearish bias; the 14-day Relative Strength Index at 47 confirms waning momentum.

GBP/USD climbs above 1.3500 as US Dollar weakens ahead of ISM Services PMI

GBP/USD gains some ground after registering modest gains in the previous session, trading around 1.3510 during the Asian hours on Wednesday. The pair edges higher as the US Dollar struggles ahead of the US ISM Services Purchasing Managers’ Index and JOLTs job openings due later in the day.

Gold pulls back from $4,500 amid profit-taking ahead of key US macro data

Gold struggles to capitalize on its strong weekly gains registered over the past two days and faces rejection near the $4,500 psychological mark, or over a one-week high touched during the Asian session on Wednesday. As investors digest the recent US attack on Venezuela, the prevalent risk-on environment prompts some profit-taking around the commodity. 

Bitcoin, Ethereum and Ripple cool off as rally stalls near key resistance zones

Bitcoin, Ethereum, and Ripple prices are taking a breather on Wednesday near their key resistance levels following the recent surge. BTC faces rejection at the $94,253 level, while ETH and XRP follow BTC’s footsteps, struggling near $3,308 and $2.35, respectively.

Implications of US intervention in Venezuela

Events in Venezuela are top of mind for market participants, and while developments are associated with an elevated degree of uncertainty, we are not making any changes to our markets or economic forecasts as a result of the deposition of Nicolás Maduro. 

Cardano holds steady as bulls intensify push for breakout

Cardano rises above the 50-day EMA resistance amid a risk-on mood across the crypto market. The MACD upholds positive divergence, increasing the potential for a 20% breakout to $0.505.