|

USD/CHF declined further, eyes on bearish cross between the 20 and 200-day SMA

  • USD/CHF fell to 0.9050, seeing 0.30% losses.
  • The USD is losing interest due to the Fed dovish tone on Wednesday’s decision.
  • Ahead of October’s Nonfarm Payrolls, the US reported weak labor market data.
  • Indicators flash signals of further downside.

In Thursday’s session, the USD/CHF saw red, mainly driven by a broad USD weakness following the Federal Reserve’s (Fed) and Jerome Powell’s remarks on Wednesday. In addition, soft labour market data is adding to the Greenback’s weakness.

On Wednesday, Jerome Powell hinted that the bank has covered significant ground. He stated that for the next decision, tighter financial conditions will be considered, as well as the cumulative effects for the next decisions. As a reaction, markets took those messages as a signal that interest rates reached its peak, which triggered a wave of risk-on flows which weakened the US Dollar.

Ahead of October’s Nonfarm Payroll on Friday, the U.S. Department of Labor revealed that the Initial Jobless Claims from the week ending in October 28 came in above the consensus. The people filling for unemployment benefits came in at 217,000, higher than the consensus 210,000 and increased concerning its last reading of 212,000.

For Friday’s job report, markets expect that the US economy added 118,000 jobs, decelerating from its revised September reading of 336,000. Wage inflation measured by the Average Hourly Earnings is forecasted to slightly decelerate while Unemployment is expected to remain steady at 3.8%. 

 USD/CHF Levels to watch 

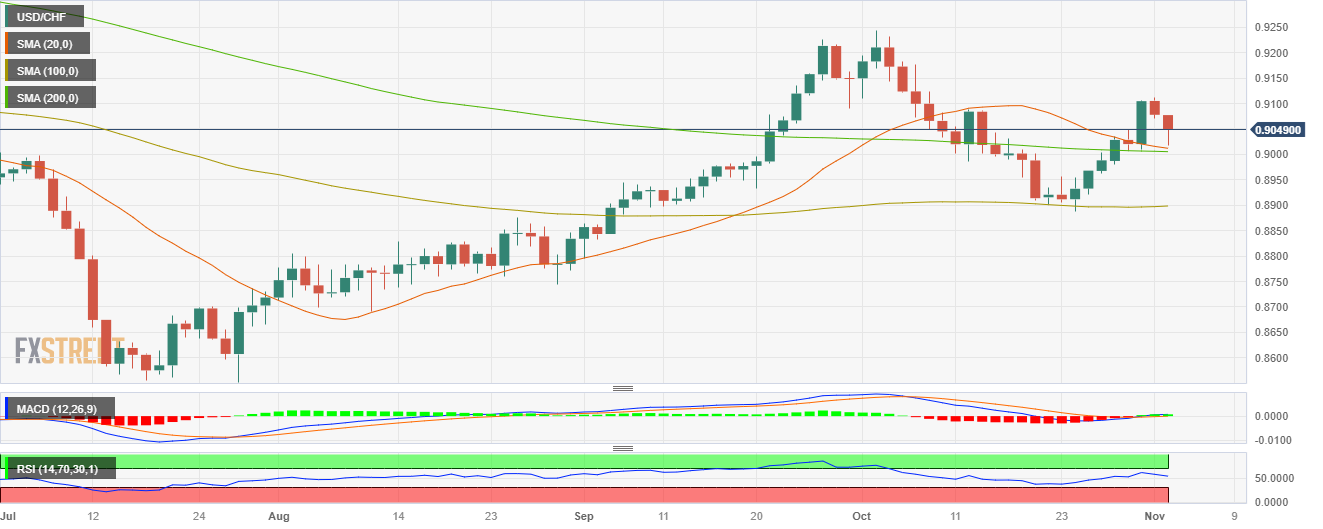
 Upon evaluating the daily chart, a neutral to bearish outlook is seen, with the balance starting to lean in favour of the bears, although they still have hurdles to overcome. The Relative Strength Index (RSI) has a negative slope above its midline, indicating weakening buying pressure, while the Moving Average Convergence (MACD) histogram shows rising red bars.

In addition, it is worth noticing that the 20 and 200-day Simple Moving Averages (SMA) are converging towards 0.9000 en route to perform a bearish cross, which could fuel further downside movements.

 Support levels: 0.9030, 0.9015, 0.9000 (20 and 200-day SMA convergence)

 Resistance levels: 0.9060, 0.9080, 0.9100.

USD/CHF Daily chart

USD/CHF

Overview
Today last price0.9051
Today Daily Change-0.0027
Today Daily Change %-0.30
Today daily open0.9078
 
Trends
Daily SMA200.9016
Daily SMA500.8994
Daily SMA1000.8897
Daily SMA2000.9006
 
Levels
Previous Daily High0.9113
Previous Daily Low0.9071
Previous Weekly High0.9035
Previous Weekly Low0.8888
Previous Monthly High0.9244
Previous Monthly Low0.8888
Daily Fibonacci 38.2%0.9087
Daily Fibonacci 61.8%0.9097
Daily Pivot Point S10.9062
Daily Pivot Point S20.9046
Daily Pivot Point S30.902
Daily Pivot Point R10.9103
Daily Pivot Point R20.9129
Daily Pivot Point R30.9145

Author

Patricio Martín

Patricio is an economist from Argentina passionate about global finance and understanding the daily movements of the markets.

More from Patricio Martín
Share:

Markets move fast. We move first.

Orange Juice Newsletter brings you expert driven insights - not headlines. Every day on your inbox.

By subscribing you agree to our Terms and conditions.

Editor's Picks

EUR/USD gathers strength above 1.1750 as Fed rate cut prospects pressure US Dollar

The EUR/USD pair trades in positive territory around 1.1775 during the early Asian session on Monday. The prospect of a US Federal Reserve rate cut in 2026 weighs on the US Dollar against the Euro. Markets brace for US President Donald Trump to nominate a Fed chair to replace Jerome Powell, whose term ends in May. 

GBP/USD edges lower near 0.7400, eyes Fed rate cut outlook

GBP/USD edges lower after a gap-up open, trading around 0.7410 during the Asian hours on Monday. However, the pair may gain ground as the US Dollar faces challenges, which could be attributed to growing expectations of two more rate cuts by the Federal Reserve in 2026.

Gold retreats from record highs, heads toward $4,550

Gold retreats after setting a new record-high at $4,550 earlier in the Asian session on Monday and eases toward $4,500 as trading volumes thin out ahead of the New Year break. The US Dollar bearish bias remains unabated on the back of dovish Fed expectations, which continues to act as a tailwind for the bullion amid persistent geopolitical risks.

Ethereum Annual Price Forecast: ETH poised for growth in 2026 amid regulatory clarity and institutional adoption

Ethereum lost 12% of its value in 2025, declining from $3,336 at the beginning of the year to $2,930 as of the third week of December, a stark contrast from 2024's 48% gain. But that percentage doesn't do justice to the wild year ETH had in 2025.

Economic outlook 2026-2027 in advanced countries: Solidity test

After a year marked by global economic resilience and ending on a note of optimism, 2026 looks promising and could be a year of solid economic performance. In our baseline scenario, we expect most of the supportive factors at work in 2025 to continue to play a role in 2026.

Avalanche struggles near $12 as Grayscale files updated form for ETF

Avalanche trades close to $12 by press time on Wednesday, extending the nearly 2% drop from the previous day. Grayscale filed an updated form to convert its Avalanche-focused Trust into an ETF with the US Securities and Exchange Commission.