|

USD/CAD technical analysis: 23.6% Fibo., 200-HMA cap recent pullback

  • RSI close to the overbought territory near key resistances indicates a reversal of latest short-covering moves by the USD/CAD pair.
  • 1.3000 continues to grab sellers’ attention.

Despite its gradual recoveries from 1.3020, the USD/CAD pair still lags key resistances as it takes the rounds to 1.3057 during early Tuesday.

Not only 23.6% Fibonacci retracement of late-June high to last week's low, at 1.3062, but 200-hour moving average (HMA) at 1.3072 also limits the pair’s immediate upside.

Should buyers refrain from respecting 1.3075 resistance, 38.2% Fibonacci retracement near 1.3090 holds the gate for the pair’s run-up towards 1.3045/50 horizontal-area comprising current month high.

Other than strong resistances, overbought levels of 14-bar relative strength index (RSI) also highlight the comeback to 1.3035 and 1.3020 whereas 1.3000 round-figure can lure sellers after.

If bears dominate momentum below 1.3000, mid-October 2018 low surrounding 1.2920 could mark their presence on the chart.

USD/CAD hourly chart

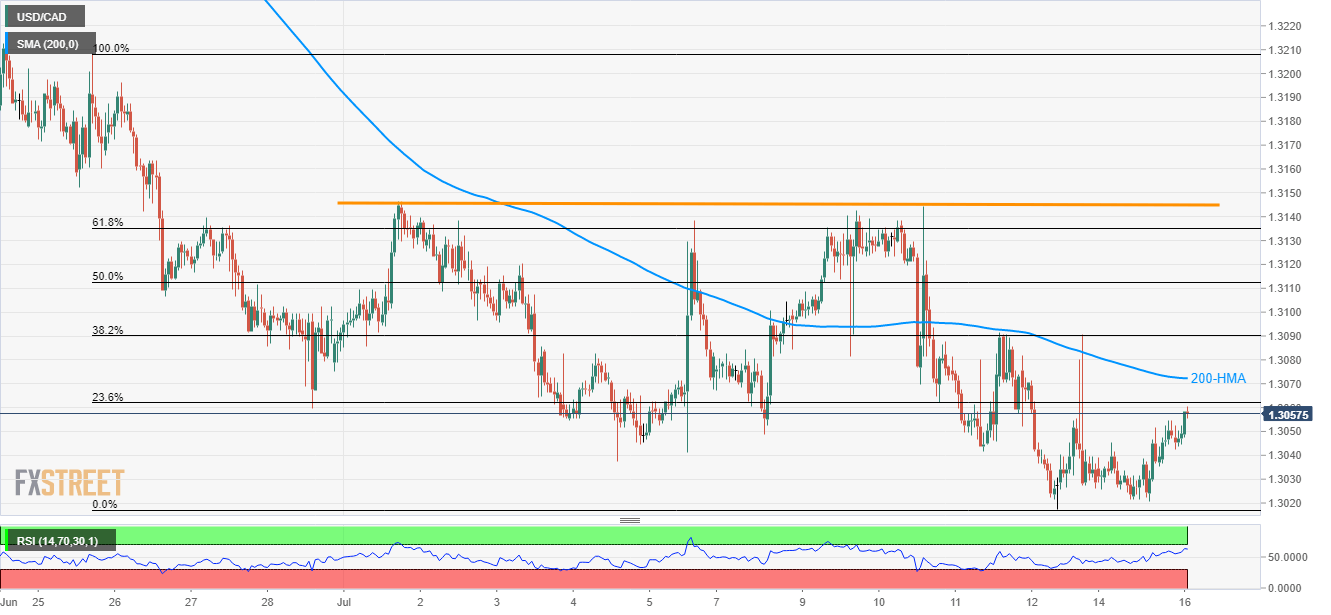
Trend: Pullback expected

    1. R3 1.3096
    2. R2 1.3075
    3. R1 1.3062
  1. PP 1.3041
    1. S1 1.3028
    2. S2 1.3007
    3. S3 1.2994

Author

Anil Panchal

Anil Panchal

FXStreet

Anil Panchal has nearly 15 years of experience in tracking financial markets. With a keen interest in macroeconomics, Anil aptly tracks global news/updates and stays well-informed about the global financial moves and their implications.

More from Anil Panchal
Share:

Editor's Picks

EUR/USD extends its optimism past 1.1900

EUR/USD retains a firm underlying bid, surpassing the 1.1900 mark as the NA session draws to a close on Monday. The pair’s persistent uptrend comes as the US Dollar remains on the defensive, with traders staying cautious ahead of upcoming US NFP prints and CPI data.
 

GBP/USD tilts bullish as markets barrel toward mid-week NFP print

GBP/USD is holding a broader bullish structure on the daily chart, with price trading well above the 50 Exponential Moving Average at 1.3507 and the 200 EMA at 1.3310, confirming the intermediate uptrend that has been in place since the November 2025 low near 1.2300. 

Gold pushes back above $5,000

The daily chart shows spot Gold in a parabolic uptrend that accelerated sharply from the $4,600 area in late January, printing a record high at $5,598.25 before a violent reversal erased nearly $1,000 in value during the final days of the month. 

Litecoin eyes $50 as heavy losses weigh on investors

Following a strong downtrend across the crypto market over the past week, Litecoin holders are under immense pressure. The Bitcoin fork has trimmed about $1.81 billion from its market capitalization since the beginning of the year, sending it below the top 20 cryptos by market cap.

Japanese PM Takaichi nabs unprecedented victory – US data eyed this week

I do not think I would be exaggerating to say that Japanese Prime Minister Sanae Takaichi’s snap general election gamble paid off over the weekend – and then some. This secured the Liberal Democratic Party (LDP) an unprecedented mandate just three months into her tenure.

Ripple exposed to volatility amid low retail interest, modest fund inflows

Ripple (XRP) is extending its intraday decline to around $1.40 at the time of writing on Monday amid growing pressure from the retail market and risk-off sentiment that continues to keep investors on the sidelines.