USD/CAD Price Forecast: Finds temporary support near 20-day EMA
- USD/CAD falls further to near 1.3850 amid weakness in the US Dollar.
- US-EU disputes over Greenland’s entitlement have weighed on US assets.
- Canadian inflation grew at a faster pace year-on-year (YoY) in December.

The USD/CAD pair trades 0.13% lower to near 1.3850 during the early European trading session on Tuesday. The Loonie pair is under pressure as the US Dollar (USD) remains on the back foot amid disputes between the United States (US) and the European Union (EU) over the future of Greenland.
As of writing, the US Dollar Index (DXY), which tracks the Greenback’s value against six major currencies, trades 0.12% down to near 98.90.
The investment risk premium of the US Dollar has diminished as President Donald Trump has imposed 10% tariffs on several EU members and the United Kingdom (UK) for opposing Greenland’s acquisition plans, with scope for further increase. In response, EU members have condemned Trump’s tariff tactic and have threatened equal countermeasures.
Meanwhile, the Canadian Dollar (CAD) trades higher after mix Consumer Price Index (CPI) data release on Monday. The CPI report showed that price pressures grew at a faster pace on an annualized basis in December, but deflated month-on-month (MoM).
USD/CAD technical analysis
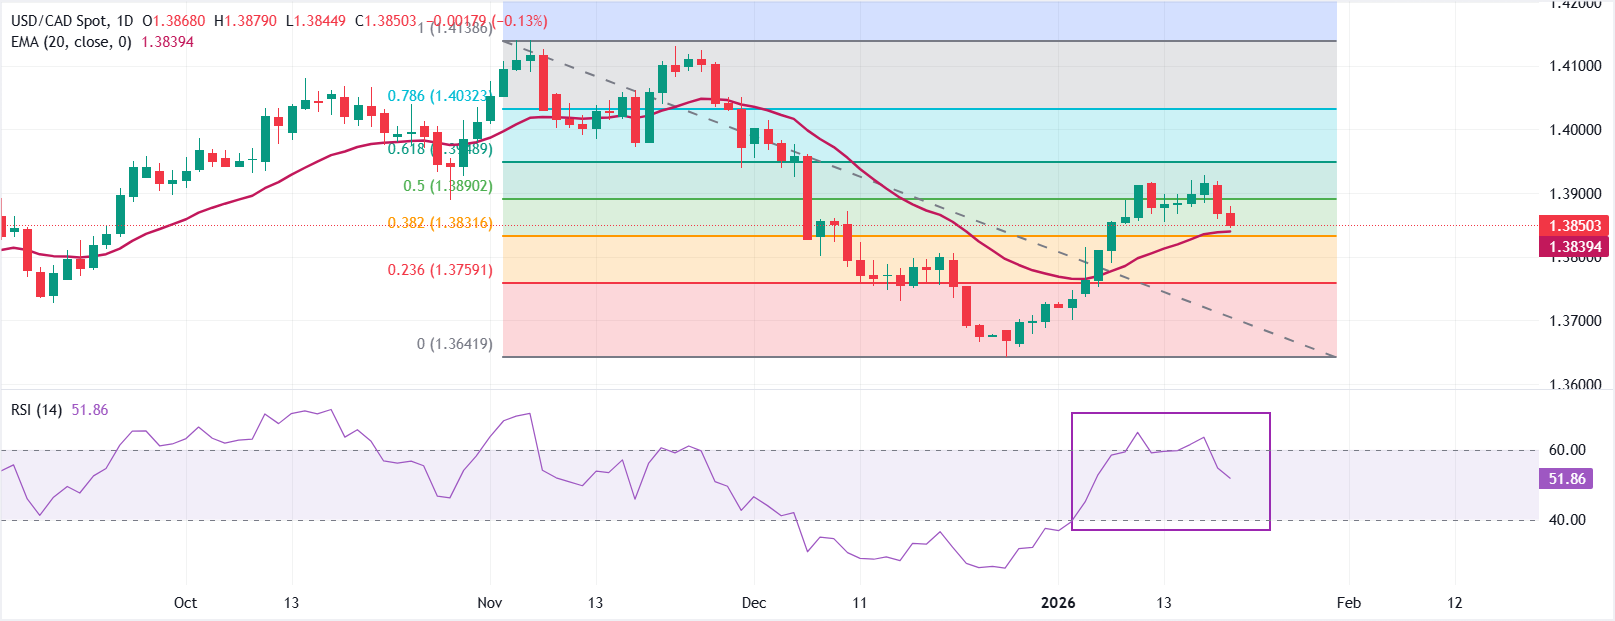
USD/CAD trades lower at around 1.3850 as of writing. However, the outlook of the pair remains bullish as the 20-day Exponential Moving Average (EMA) accelerates to 1.3839, and price holds marginally above it, preserving a recovery stance.
The 14-day Relative Strength Index (RSI) at 52 (neutral) after a rebound from oversold readings confirms momentum stabilization.
Measured from the 1.4139 high to the 1.3642 low, the pair corrects to near the 38.2% Fibonacci retracement at 1.3832 after struggling to stabilze above the 50% Fibonacci retracement at 1.3890.
The 20-day EMA’s positive slope supports the bounce, with the pair consolidating above the average. A decisive bounce above the January 16 high of 1.3929 would lead to a fresh upside leg towards the psychological level of 1.4000. On the contrary, a close below 38.2% Fibonacci retracement at 1.3832 would weaken the near-term setup and extend the corrective leg toward 23.6% Fibonacci retracement at 1.3759.
(The technical analysis of this story was written with the help of an AI tool.)
Economic Indicator
Consumer Price Index (YoY)
The Consumer Price Index (CPI), released by Statistics Canada on a monthly basis, represents changes in prices for Canadian consumers by comparing the cost of a fixed basket of goods and services. The YoY reading compares prices in the reference month to the same month a year earlier. Generally, a high reading is seen as bullish for the Canadian Dollar (CAD), while a low reading is seen as bearish.
Read more.Last release: Mon Jan 19, 2026 13:30
Frequency: Monthly
Actual: 2.4%
Consensus: 2.2%
Previous: 2.2%
Source: Statistics Canada
Author

Sagar Dua
FXStreet
Sagar Dua is associated with the financial markets from his college days. Along with pursuing post-graduation in Commerce in 2014, he started his markets training with chart analysis.

















