|

USD/CAD Price Analysis: Struggles to capitalize on its modest intraday gains beyond 1.3700

  • USD/CAD recovers further from the 50-day SMA and draws support from a combination of factors.
  • Sliding Crude Oil prices undermine the Loonie and act as a tailwind amid a modest USD strength.
  • The mixed technical setup warrants caution for bulls and before positioning for any further gains.

The USD/CAD pair attracts some buying on Thursday and sticks to its modest intraday gains, just below the 1.3700 round-figure mark through the first half of the European session.

Crude Oil prices drift lower for the third successive day, which is seen undermining the commodity-linked Loonie. This, along with a further US Dollar (USD) recovery from its lowest level since September 1 touched in the aftermath of the softer US CPI report on Tuesday, turns out to be another factor acting as a tailwind for the USD/CAD pair.

From a technical perspective, spot prices managed to defend the 50-day Simple Moving Average (SMA) support near the 1.3655 area on Wednesday and the subsequent move up favours bullish traders. That said, the lack of follow-through buying warrants caution before positioning for further gains amid bets that the Federal Reserve (Fed) is done hiking rates.

Moreover, oscillators on the daily chart have just started gaining negative traction. Hence, a convincing break below the 50-day SMA support will be seen as a fresh trigger for bearish traders and pave the way for deeper losses. The USD/CAD pair might then slide to the monthly low, around the 1.3630-1.3625 region, en route to the 1.3600 round figure.

On the flip side, a sustained strength beyond the 1.3710-1.3715 region could trigger an intraday short-covering move and lift spot prices to the next relevant hurdle near the 1.3750-1.3755 area. Any further move up, however, might still be seen as a selling opportunity and runs the risk of fizzling out rather quickly ahead of the 1.3800 round-figure mark.

The latter should act as a key pivotal point, which if cleared decisively will shift the near-term bias back in favour of bullish traders. The USD/CAD pair might then accelerate the momentum towards the next relevant hurdle near the 1.3870-1.3875 region en route to the 1.3900 mark, or the highest level since May 2020 touched on earlier this month.

USD/CAD daily chart
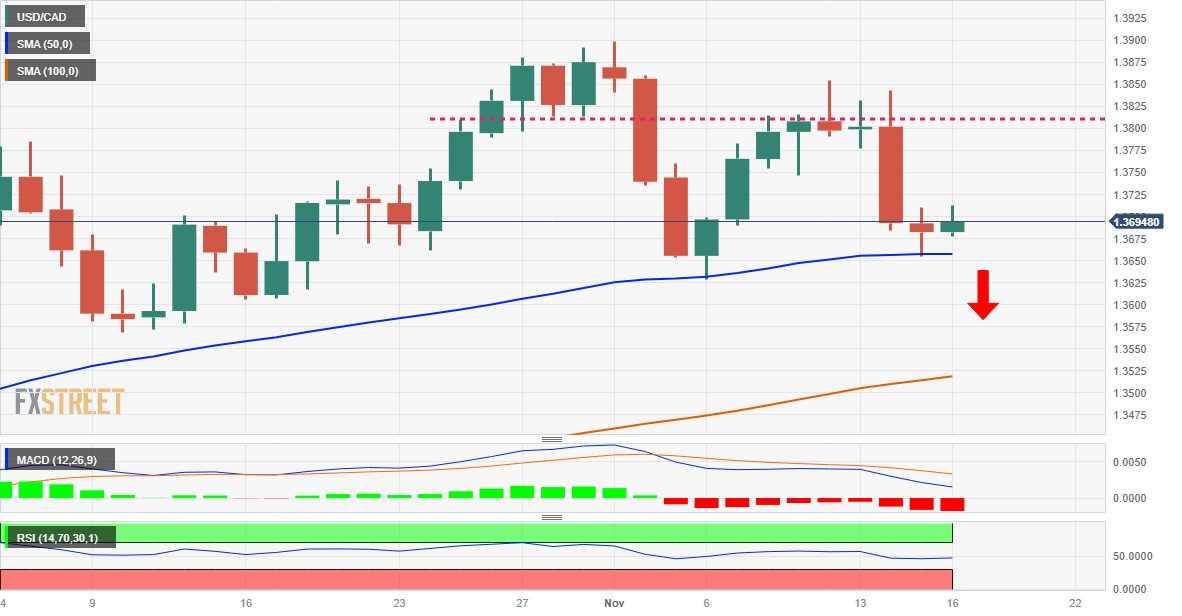
fxsoriginal

Technical levels to watch

USD/CAD

Overview
Today last price1.3695
Today Daily Change0.0013
Today Daily Change %0.10
Today daily open1.3682
 
Trends
Daily SMA201.3768
Daily SMA501.3657
Daily SMA1001.3514
Daily SMA2001.3506
 
Levels
Previous Daily High1.371
Previous Daily Low1.3655
Previous Weekly High1.3855
Previous Weekly Low1.3629
Previous Monthly High1.3892
Previous Monthly Low1.3562
Daily Fibonacci 38.2%1.3676
Daily Fibonacci 61.8%1.3689
Daily Pivot Point S11.3655
Daily Pivot Point S21.3627
Daily Pivot Point S31.3599
Daily Pivot Point R11.371
Daily Pivot Point R21.3738
Daily Pivot Point R31.3766

Author

Haresh Menghani

Haresh Menghani is a detail-oriented professional with 10+ years of extensive experience in analysing the global financial markets.


More from Haresh Menghani
Share:

Editor's Picks

GBP/USD slips toward 1.3350 after soft UK CPI data

GBP/USD erases recovery gains and slips toward 1.3350 in the European session on Wednesday. The UK annual Consumer Price Index (CPI) inflation cooled to 2.6% in June against the market forecast of 2.7%, tempering the British Pound's rebound from weekly troughs. Traders also assess the ongoing Mideast tensions amid a pause in the US Dollar uptrend.

EUR/USD holds above 1.1400 amid US Dollar retreat

EUR/USD holds positive ground above 1.1400 in European trading on Wednesday, helped by hawkish ECB expectations and a broad US Dollar retreat. However, persisting Middle East tensions and surging Oil prices keep the pair's upside elusive.

Gold holds gains above $4,100 undaunted by risk-off markets

Gold extends gains for the fourth consecutive day, standing comfortably above $4,100, unfazed by the risk-off market amid rising tensions in Iran and higher Oil prices. The pair has rallied nearly 2.5% so far this week and is on track for its best weekly performance in more than three months.

Cardano: Short-term recovery lacks retail support

Cardano price edges lower after the 50-day Exponential Moving Average at $1.770 capped two consecutive days of recovery seen earlier this week. ADA futures point to waning retail traction as Open Interest and trading volume decline amid elevated long liquidations. The technical outlook for ADA is bearish, as momentum remains subdued below a resistance trendline near $0.1782.

Chip stocks are more volatile than Oil

I continue to start the day by looking at these two charts: US crude & Kospi. The former is extending gains, trading above $86 per barrel for WTI and $92 per barrel for Brent, while the Kospi is up more than 4.5%, led higher by Korean chipmakers following a similar jump in VanEck's Semiconductor ETF yesterday.

US Dollar mid-year outlook: Exceptional currency, exceptional risks?
The US Dollar enters the second half of 2026 in a markedly different position from a year ago. The King currency has recovered, reflecting persistent US inflation, changing expectations for Fed policy, geopolitical tensions and renewed demand for defensive assets.














