USD/CAD Price Analysis: Remains subdued near 1.3700 as US Dollar slips
- USD/CAD struggles to hold the 1.3700 support as the US Dollar edges down.
- US bond yields consolidate as investors focus on US core PCE Price Index data.
- BoC’s rate cut prospects remain strong as Canada’s inflation softens significantly in March.

The USD/CAD pair remains feeble near the round-level support of 1.3700 in Tuesday’s European session. The Loonie asset comes under pressure as the US Dollar drops amid improvement in the risk appetite of the market participants.
S&P 500 futures have posted some gains in the London session. The appeal for risky assets improves as investors see no further escalation in Middle East conflict on an immediate basis. 10-year US Treasury yields consolidate around 4.63% as investors shift focus to the United States core Personal Consumption Expenditure Price Index (PCE) data for March, which will be published on Friday. The US Dollar Index (DXY) edges down to 105.96.
The underlying inflation data will significantly influence market expectations to Federal Reserve (Fed) rate cuts, which traders anticipate from the September meeting. The annual core PCE Price Index is forecasted to have softened to 2.6% from 2.8% in February with monthly inflation increasing steadily by 0.3%.
Meanwhile, the Canadian Dollar has consistently performed better against the US Dollar since the last trading sessions. The Canadian Dollar could weaken as investors see the Bank of Canada (BoC) starting to reduce interest rates earlier amid easing price pressures. BoC’s preferred inflation measure that excludes eight volatile items softened to 2% in March, allowing policymakers to discuss rate cuts.
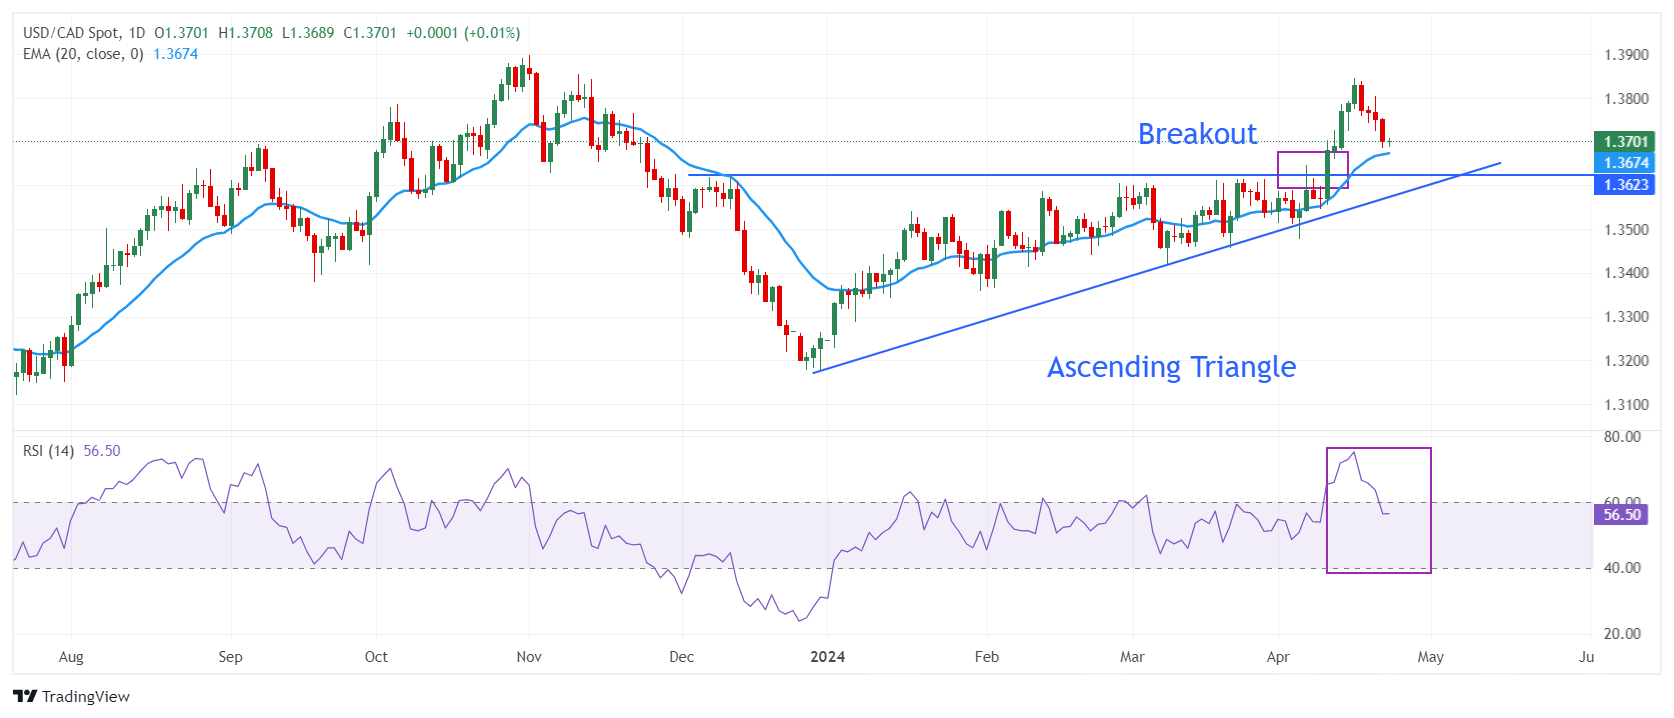
USD/CAD faced sharp selling pressure last week after a rally stalled near 1.3850. The asset rallied after a breakout of the Ascending Triangle chart pattern formed on a daily timeframe. The 20-day Exponential Moving Average (EMA) near 1.3674 will be a major support area for the US Dollar bulls.
The 14-period Relative Strength Index (RSI) returns to the 40.00-60.00 range, which indicates that bullish momentum has concluded for now while the upside bias is still intact.
Going forward, a mean-reversion move to near the 20-day EMA around 1.3674 will offer a buying opportunity to market participants. Investors would find resistance near the 22 November 2023, high at 1.3766, followed by the round-level resistance of 1.3800.
In an alternate scenario, a breakdown below April 9 low around 1.3547 will expose the asset to the psychological support of 1.3500 and March 21 low around 1.3456.
USD/CAD daily chart
Author

Sagar Dua
FXStreet
Sagar Dua is associated with the financial markets from his college days. Along with pursuing post-graduation in Commerce in 2014, he started his markets training with chart analysis.

















