|

USD/CAD Price Analysis: Maintains its position near 1.3330 ahead of the US key events

  • USD/CAD moves sideways after halting a winning streak that began on December 27.
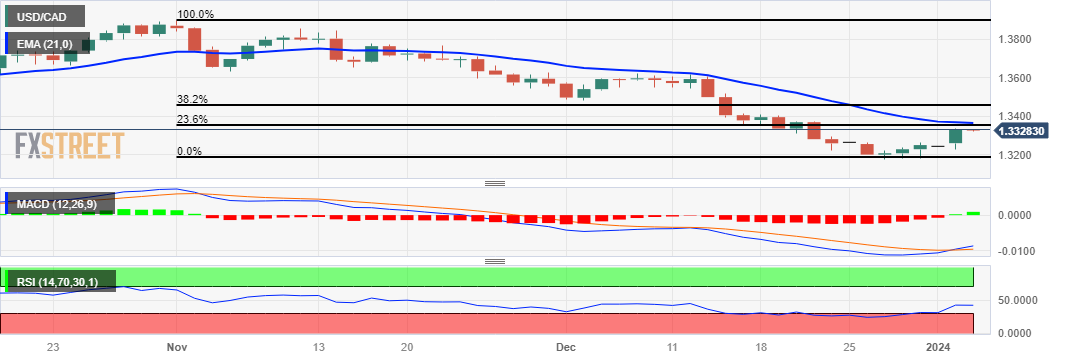
  • MACD indicator suggests a potential shift in the pair’s direction.
  • A break above the 23.6% Fibonacci retracement at 1.3351 could lead the pair to surpass the 21-day EMA at 1.3363.

USD/CAD hovers near 1.3330 during the Asian session on Wednesday. The USD/CAD pair receives upward support as investors turn back to the US Dollar (USD) on risk-off sentiment.

The technical analysis of the Moving Average Convergence Divergence (MACD) for the USD/CAD pair suggests a potential shift in the pair's trend as the MACD line lies below the centreline but shows divergence above the signal line.

However, the lagging indicator 14-day Relative Strength Index (RSI) is positioned below 50. Traders will likely wait for confirmation implying that the USD/CAD pair could change its direction.

The USD/CAD pair could find key support near the psychological level at 1.3300 following the major support at 1.3250 level. A break below the latter could push the pair to navigate the region around the weekly low at 1.3228 followed by the psychological level at 1.3200.

The analysis suggests that on the upside, the major level at 1.3350 aligned with the 23.6% Fibonacci retracement level at 1.3351 could act as a key resistance zone. A breakthrough above the key resistance zone could lead the USD/CAD pair to surpass the 21-day Exponential Moving Average (EMA) at 1.3363 following the psychological barrier at 1.3400.

If the USD/CAD pair manages to pass through the psychological resistance, it may explore further upward movement toward the 38.2% Fibonacci retracement level at 1.3456.

USD/CAD: Daily Chart

USD/CAD: more technical levels

Overview
Today last price1.3326
Today Daily Change-0.0005
Today Daily Change %-0.04
Today daily open1.3331
 
Trends
Daily SMA201.3379
Daily SMA501.358
Daily SMA1001.3585
Daily SMA2001.3485
 
Levels
Previous Daily High1.3334
Previous Daily Low1.3229
Previous Weekly High1.3267
Previous Weekly Low1.3178
Previous Monthly High1.362
Previous Monthly Low1.3178
Daily Fibonacci 38.2%1.3294
Daily Fibonacci 61.8%1.3269
Daily Pivot Point S11.3262
Daily Pivot Point S21.3193
Daily Pivot Point S31.3157
Daily Pivot Point R11.3367
Daily Pivot Point R21.3403
Daily Pivot Point R31.3472

Author

Akhtar Faruqui

Akhtar Faruqui is a Forex Analyst based in New Delhi, India. With a keen eye for market trends and a passion for dissecting complex financial dynamics, he is dedicated to delivering accurate and insightful Forex news and analysis.

More from Akhtar Faruqui
Share:

Editor's Picks

AUD/USD eyes 0.7150 barrier nine-day EMA

AUD/USD inches higher after registering modest losses in the previous day, trading around 0.7130 during the Asian hours. The technical analysis of the daily chart indicates that the pair is moving sideways within the rectangle pattern, suggesting a consolidation as neither the bulls nor the bears have enough momentum to take control of the market.

USD/JPY trades below 160.00 intervention threshold; bullish bias intact

The USD/JPY pair attracts some sellers during the Asian session amid fears that authorities will step in again to prop up the Japanese Yen. Furthermore, the Israel-Lebanon truce prompts some profit-taking around the US Dollar and exerts downward pressure on the currency pair.

Gold rebounds from one-week low as Israel-Lebanon truce pressures safe-haven USD

Gold gains some positive traction on Thursday and climbs to the $4,475 area during the Asian session, reversing a major part of the previous day's slide to a one-week low. The Israel-Lebanon truce prompts some profit-taking around the US Dollar and supports the commodity. 


Hyperliquid: ETF demand, capital rotation fuel HYPE rally as Bitcoin melts

Hyperliquid price sustains an upward trend near its all-time high of $75.76 on Thursday after posting 80% gains in May, while Bitcoin (BTC) retraces below $65,000, triggering a market-wide panic.

Kevin Warsh takes the Fed helm: What it means for the US Dollar
The Federal Reserve moves away from the highly predictable "forward guidance" model of the Jerome Powell era to a new “Kevin Warsh environment”, characterized by less communication, more policy surprises, and an increased focus on the Fed's complex balance sheet.
Recession on paper: What really moves the Canadian Loonie now?

Statistics Canada handed the headline writers a gift and the analysts a headache. Real GDP shrank 0.1% on an annualized basis in the first quarter, and with the fourth quarter of 2025 revised down to a 1.0% contraction, that is two negative quarters in a row, the textbook definition of a technical recession and Canada's first since the pandemic.