USD/CAD Price Analysis: Justifies bullish Doji candlestick to snap three-day downtrend near 1.3600


  • USD/CAD prints the first daily gain in four, mildly bid of late.
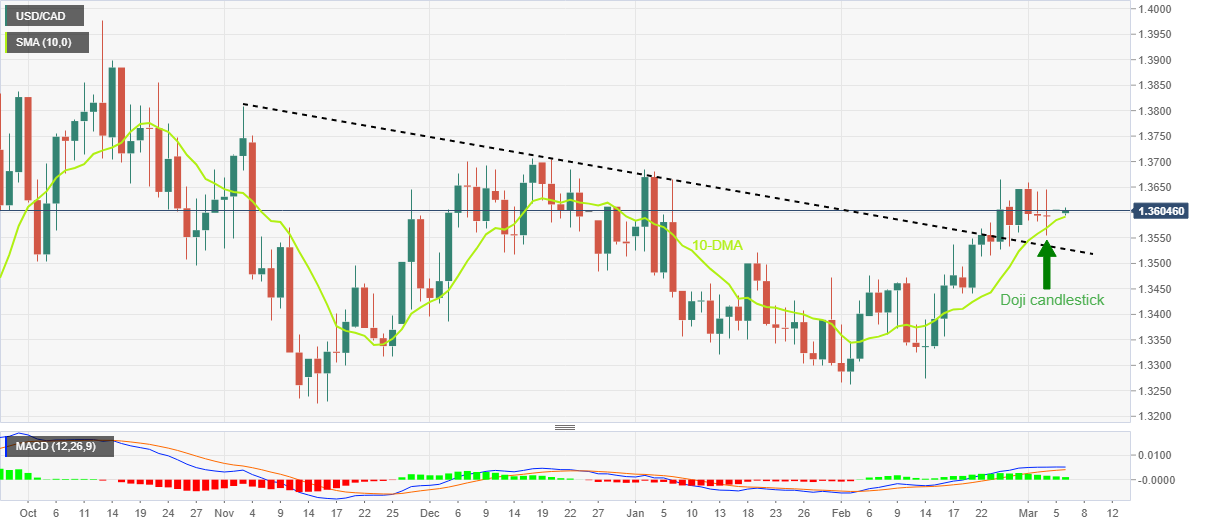
  • Bullish candlestick formation, upbeat MACD signals keep buyers hopeful.
  • Sustained break of four-month-old previous resistance line strengthens the bullish bias.

USD/CAD prints mild gains around 1.3600 as bears take a breather after a three-day losing streak during early Monday morning in Asia.

In doing so, the Loonie pair justifies the previous day’s bullish Doji candlestick, as well as upbeat MACD signals, to back the pair’s rebound from the 10-DMA support. The Loonie pair’s further recovery, however, needs validation from the previous monthly high surrounding 1.3665 to convince USD/CAD buyers.

Even if the Loonie pair manages to stay beyond the 1.3665 hurdle, the late 2022 peak of 1.3705 appears the key as it holds the gate for the quote’s run-up towards the last November’s high surrounding 1.3810.

Should the USD/CAD pair remains firmer past 1.3810, the odds of its run-up to challenge the previous yearly high of 1.3977 can’t be ruled out.

On the flip side, the 10-DMA and previous resistance line from November 2022, respectively around 1.3590 and 1.3525 challenge the USD/CAD bears.

Following that, multiple support levels around 1.3480-70 and 1.3330 could restrict the pair’s further downside before highlighting the previous monthly low of 1.3262, as well as the last November’s trough surrounding 1.3225 for bears.

Overall, USD/CAD is likely to be firmer unless breaking the 1.3525 level, but the upside room appears limited.

USD/CAD: Daily chart

Trend: Further upside expected

Additional important levels

Overview
Today last price 1.3605
Today Daily Change 0.0012
Today Daily Change % 0.09%
Today daily open 1.3593
 
Trends
Daily SMA20 1.349
Daily SMA50 1.3459
Daily SMA100 1.3502
Daily SMA200 1.3284
 
Levels
Previous Daily High 1.3644
Previous Daily Low 1.3555
Previous Weekly High 1.3659
Previous Weekly Low 1.3534
Previous Monthly High 1.3666
Previous Monthly Low 1.3262
Daily Fibonacci 38.2% 1.3589
Daily Fibonacci 61.8% 1.361
Daily Pivot Point S1 1.3551
Daily Pivot Point S2 1.3508
Daily Pivot Point S3 1.3461
Daily Pivot Point R1 1.364
Daily Pivot Point R2 1.3687
Daily Pivot Point R3 1.3729


Share: Feed news

Information on these pages contains forward-looking statements that involve risks and uncertainties. Markets and instruments profiled on this page are for informational purposes only and should not in any way come across as a recommendation to buy or sell in these assets. You should do your own thorough research before making any investment decisions. FXStreet does not in any way guarantee that this information is free from mistakes, errors, or material misstatements. It also does not guarantee that this information is of a timely nature. Investing in Open Markets involves a great deal of risk, including the loss of all or a portion of your investment, as well as emotional distress. All risks, losses and costs associated with investing, including total loss of principal, are your responsibility. The views and opinions expressed in this article are those of the authors and do not necessarily reflect the official policy or position of FXStreet nor its advertisers. The author will not be held responsible for information that is found at the end of links posted on this page.

If not otherwise explicitly mentioned in the body of the article, at the time of writing, the author has no position in any stock mentioned in this article and no business relationship with any company mentioned. The author has not received compensation for writing this article, other than from FXStreet.

FXStreet and the author do not provide personalized recommendations. The author makes no representations as to the accuracy, completeness, or suitability of this information. FXStreet and the author will not be liable for any errors, omissions or any losses, injuries or damages arising from this information and its display or use. Errors and omissions excepted.

The author and FXStreet are not registered investment advisors and nothing in this article is intended to be investment advice.

Recommended content


Recommended content

Editors’ Picks

EUR/USD alternates gains with losses near 1.0720 post-US PCE

EUR/USD alternates gains with losses near 1.0720 post-US PCE

The bullish tone in the Greenback motivates EUR/USD to maintain its daily range in the low 1.070s in the wake of firmer-than-estimated US inflation data measured by the PCE.

EUR/USD News

GBP/USD clings to gains just above 1.2500 on US PCE

GBP/USD clings to gains just above 1.2500 on US PCE

GBP/USD keeps its uptrend unchanged and navigates the area beyond 1.2500 the figure amidst slight gains in the US Dollar following the release of US inflation tracked by the PCE.

GBP/USD News

Gold keeps its daily gains near $2,350 following US inflation

Gold keeps its daily gains near $2,350 following US inflation

Gold prices maintain their constructive bias around $2,350 after US inflation data gauged by the PCE surpassed consensus in March and US yields trade with slight losses following recent peaks.

Gold News

Bitcoin Weekly Forecast: BTC’s next breakout could propel it to $80,000 Premium

Bitcoin Weekly Forecast: BTC’s next breakout could propel it to $80,000

Bitcoin’s recent price consolidation could be nearing its end as technical indicators and on-chain metrics suggest a potential upward breakout. However, this move would not be straightforward and could punish impatient investors. 

Read more

Week ahead – Hawkish risk as Fed and NFP on tap, Eurozone data eyed too

Week ahead – Hawkish risk as Fed and NFP on tap, Eurozone data eyed too

Fed meets on Wednesday as US inflation stays elevated. Will Friday’s jobs report bring relief or more angst for the markets? Eurozone flash GDP and CPI numbers in focus for the Euro.

Read more

Forex MAJORS

Cryptocurrencies

Signatures