|

USD/CAD Price Analysis: Hovers below 1.3600 on downbeat oil prices, Fed decision eyed

  • USD/CAD grapples to extend its gains on the back of subdued Crude oil prices.
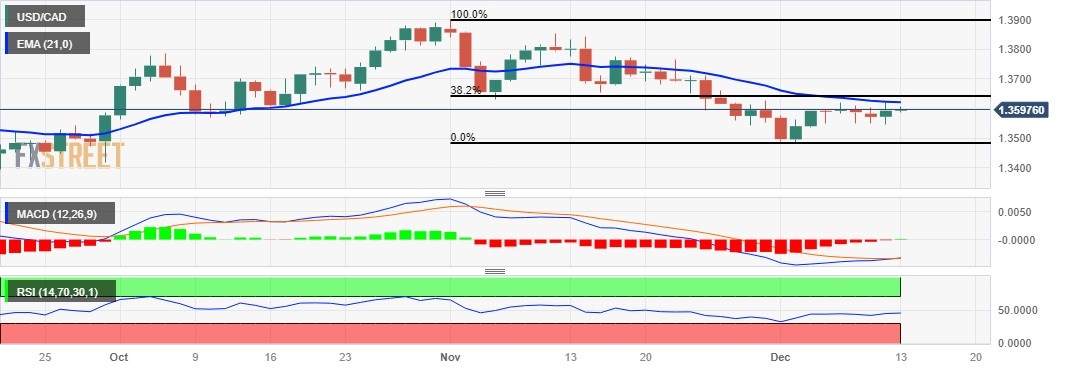
  • A firm breakthrough above 1.3600 could lead the pair to reach a 21-day EMA at 1.3620.
  • 14-day RSI lies below the 50 mark; the 1.3550 level could act as key support.

USD/CAD struggles to extend its gains for the second successive day while US Dollar (USD) stays in the positive territory. The downbeat Crude oil prices reinforce the downward pressure on the Canadian Dollar (CAD). The USD/CAD pair trades higher around 1.3590 during the European session on Wednesday.

The USD/CAD pair finds the psychological level at 1.3600 as a key barrier. A firm break above the latter could inspire the bulls of the USD/CAD pair to explore the 21-day Exponential Moving Average (EMA) at 1.3620 followed by the 38.2% Fibonacci retracement level at 1.3840 before the major resistance at 1.3650 level.

The technical indicator Moving Average Convergence Divergence (MACD) for the USD/CAD pair signals a potential bullish trend reversal. MACD line lies below the centerline and crosses above the signal line. The crossover above the signal line suggests that the shorter-term moving average is gaining strength relative to the longer-term moving average, indicating a shift towards positive momentum in the pair.

However, the analysis suggests a dovish sentiment for the USD/CAD pair, with the 14-day Relative Strength Index (RSI) below 50. This implies a weakness in the pair, and it could lose ground. The mentioned support levels, including the major level around 1.3550 and the psychological support at 1.3500, are crucial markers to watch.

If the USD/CAD pair breaks below the latter, it might encounter further bearish pressure, potentially navigating toward the region around the previous week's low at 1.3480.

USD/CAD: Daily Chart

USD/CAD: More technical levels

Overview
Today last price1.3592
Today Daily Change0.0000
Today Daily Change %0.00
Today daily open1.3592
 
Trends
Daily SMA201.3626
Daily SMA501.3688
Daily SMA1001.3591
Daily SMA2001.3516
 
Levels
Previous Daily High1.3619
Previous Daily Low1.3545
Previous Weekly High1.362
Previous Weekly Low1.348
Previous Monthly High1.3899
Previous Monthly Low1.3541
Daily Fibonacci 38.2%1.3591
Daily Fibonacci 61.8%1.3573
Daily Pivot Point S11.3552
Daily Pivot Point S21.3512
Daily Pivot Point S31.3479
Daily Pivot Point R11.3626
Daily Pivot Point R21.3659
Daily Pivot Point R31.3699

Author

Akhtar Faruqui

Akhtar Faruqui is a Forex Analyst based in New Delhi, India. With a keen eye for market trends and a passion for dissecting complex financial dynamics, he is dedicated to delivering accurate and insightful Forex news and analysis.

More from Akhtar Faruqui
Share:

Markets move fast. We move first.

Orange Juice Newsletter brings you expert driven insights - not headlines. Every day on your inbox.

By subscribing you agree to our Terms and conditions.

Editor's Picks

EUR/USD edges above 1.1750 due to ECB-Fed policy divergence

EUR/USD has recovered its recent losses registered in the previous session, trading around 1.1760 during the Asian hours on Friday. Traders will likely observe Germany’s Manufacturing Purchasing Managers’ Index data later in the day.

GBP/USD gathers strength above 1.3450 on Fed rate cut bets, BoE's gradual policy path

The GBP/USD pair gathers strength to around 1.3480 during the early Asian session on Friday. Expectations of the US Federal Reserve rate cuts this year weigh on the US Dollar against the Pound Sterling. Philadelphia Fed President Anna Paulson is set to speak later on the weekend. 

Gold climbs to near $4,350 on Fed rate cut bets, geopolitical risks

Gold price rises to near $4,345 during the early Asian session on Friday. Gold finished 2025 with a significant rally, achieving an annual gain of around 65%, its biggest annual gain since 1979. The rally of the precious metal is bolstered by the prospect of further US interest rate cuts in 2026 and safe-haven flows.

Bitcoin trades in compression as 2026 begins with structure still unresolved

BTC/USD remains locked in a two-way structure, with micro supply-and-demand levels guiding early-year price behaviour.

Economic outlook 2026-2027 in advanced countries: Solidity test

After a year marked by global economic resilience and ending on a note of optimism, 2026 looks promising and could be a year of solid economic performance. In our baseline scenario, we expect most of the supportive factors at work in 2025 to continue to play a role in 2026.

Crypto market outlook for 2026

Year 2025 was volatile, as crypto often is.  Among positive catalysts were favourable regulatory changes in the U.S., rise of Digital Asset Treasuries (DAT), adoption of AI and tokenization of Real-World-Assets (RWA).