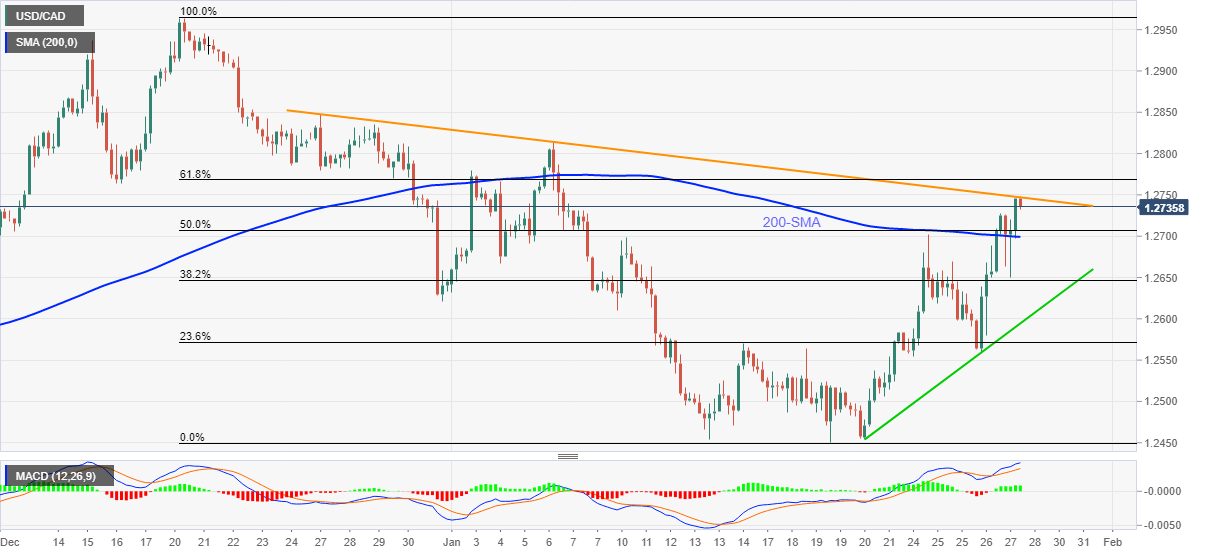
- USD/CAD pauses two-day uptrend near the highest levels in three weeks.
- Bullish MACD signals, sustained break of 200-SMA keep buyers hopeful.
- Weekly ascending trend line acts as the key short-term support.
USD/CAD retreats from a three-week high to 1.2736 during a quiet Asian session on Friday. In doing so, the Loonie pair drops for the first time in three days while stepping back from a one-month-old descending resistance line.
Even so, the quote’s successful trading above the 1.2695-2710 support zone, comprising 200-SMA and 50% Fibonacci retracement (Fibo.) of December-January declines, keeps USD/CAD buyers hopeful amid bullish MACD signals.
It’s worth noting that 61.8% Fibo. level near 1.2770 acts as an additional upside hurdle, should the quote manage to cross the immediate trend line barrier around 1.2750.
In a case where USD/CAD manages to stay firmer past 1.2770, the monthly high of 1.2813 and the late December tops close to 1.2850 will test the further advances before directing the quote towards the last month’s peak of 1.2964.
On the flip side, short-term sellers will gain momentum on the break of 1.2695. However, an ascending support line from January 20, near 1.2595, will challenge the USD/CAD sellers afterward.
If at all the USD/CAD bears conquer the 1.2595 support, the 23.6% Fibonacci retracement level of 1.2571 may offer an intermediate halt during the anticipated fall towards the monthly low of 1.2450.
USD/CAD: Four-hour chart
Trend: Further upside expected
Information on these pages contains forward-looking statements that involve risks and uncertainties. Markets and instruments profiled on this page are for informational purposes only and should not in any way come across as a recommendation to buy or sell in these assets. You should do your own thorough research before making any investment decisions. FXStreet does not in any way guarantee that this information is free from mistakes, errors, or material misstatements. It also does not guarantee that this information is of a timely nature. Investing in Open Markets involves a great deal of risk, including the loss of all or a portion of your investment, as well as emotional distress. All risks, losses and costs associated with investing, including total loss of principal, are your responsibility. The views and opinions expressed in this article are those of the authors and do not necessarily reflect the official policy or position of FXStreet nor its advertisers. The author will not be held responsible for information that is found at the end of links posted on this page.
If not otherwise explicitly mentioned in the body of the article, at the time of writing, the author has no position in any stock mentioned in this article and no business relationship with any company mentioned. The author has not received compensation for writing this article, other than from FXStreet.
FXStreet and the author do not provide personalized recommendations. The author makes no representations as to the accuracy, completeness, or suitability of this information. FXStreet and the author will not be liable for any errors, omissions or any losses, injuries or damages arising from this information and its display or use. Errors and omissions excepted.
The author and FXStreet are not registered investment advisors and nothing in this article is intended to be investment advice.
Recommended content
Editors’ Picks
EUR/USD edges lower toward 1.0700 post-US PCE

EUR/USD stays under modest bearish pressure but manages to hold above 1.0700 in the American session on Friday. The US Dollar (USD) gathers strength against its rivals after the stronger-than-forecast PCE inflation data, not allowing the pair to gain traction.
GBP/USD retreats to 1.2500 on renewed USD strength

GBP/USD lost its traction and turned negative on the day near 1.2500. Following the stronger-than-expected PCE inflation readings from the US, the USD stays resilient and makes it difficult for the pair to gather recovery momentum.
Gold struggles to hold above $2,350 following US inflation

Gold turned south and declined toward $2,340, erasing a large portion of its daily gains, as the USD benefited from PCE inflation data. The benchmark 10-year US yield, however, stays in negative territory and helps XAU/USD limit its losses.
Bitcoin Weekly Forecast: BTC’s next breakout could propel it to $80,000 Premium

Bitcoin’s recent price consolidation could be nearing its end as technical indicators and on-chain metrics suggest a potential upward breakout. However, this move would not be straightforward and could punish impatient investors.
Week ahead – Hawkish risk as Fed and NFP on tap, Eurozone data eyed too

Fed meets on Wednesday as US inflation stays elevated. Will Friday’s jobs report bring relief or more angst for the markets? Eurozone flash GDP and CPI numbers in focus for the Euro.