|

USD/CAD Price Analysis: Corrects from three-month highs near 1.2850

  • USD/CAD faces rejection once again near 1.2850 amid firmer WTI prices.
  • The major has room to rise further amid a bullish breakout and firmer RSI.  
  • The immediate downside could find some support at the 1.2790 price zone.

USD/CAD is extending its corrective pullback from three-month highs of 1.2846, now attacking the 1.2800 level amid a rebound in oil prices.

The pair fails to benefit from the resurgent US dollar demand across the board, as WTI rebounds over 2% so far this Monday.

Meanwhile, investors move past the mixed US and Canadian employment data, as they await the Bank of Canada (BOC) rate decision due to be announced on Wednesday.

Looking at USD/CAD’s daily chart, the bears have fought back control, as the price now looks to test the critical trendline resistance now support at 1.2791.

Despite the pullback, the bullish potential remains intact after the pair witnessed an upside breakout from the three-month-long falling trendline support last Thursday.

The 14-day Relative Strength Index (RSI) is sitting just beneath the overbought territory, allowing more room for the upside.

Bulls will need to cross the multi-month highs to take on the September highs at 1.2896.

USD/CAD: Daily chart

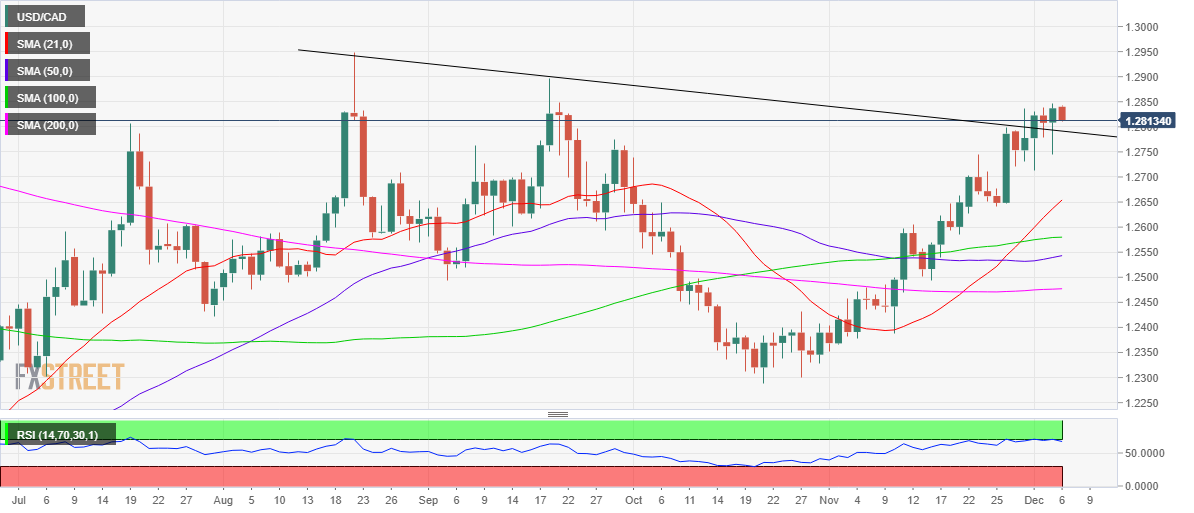
On the downside, a firm break below the abovementioned strong support at 1.2791 could accentuate the correction towards Friday’s low of 1.2744.

The next bearish target is envisioned at 1.2700 if the selling pressure accelerates.

USD/CAD: Additional levels

USD/CAD

Overview
Today last price1.2810
Today Daily Change-0.0025
Today Daily Change %-0.19
Today daily open1.2837
 
Trends
Daily SMA201.2646
Daily SMA501.2539
Daily SMA1001.2579
Daily SMA2001.2476
 
Levels
Previous Daily High1.2846
Previous Daily Low1.2744
Previous Weekly High1.2846
Previous Weekly Low1.2713
Previous Monthly High1.2837
Previous Monthly Low1.2352
Daily Fibonacci 38.2%1.2807
Daily Fibonacci 61.8%1.2783
Daily Pivot Point S11.2772
Daily Pivot Point S21.2707
Daily Pivot Point S31.267
Daily Pivot Point R11.2874
Daily Pivot Point R21.2911
Daily Pivot Point R31.2976

Author

Dhwani Mehta

Dhwani Mehta

FXStreet

Residing in Mumbai (India), Dhwani is a Senior Analyst and Manager of the Asian session at FXStreet. She has over 10 years of experience in analyzing and covering the global financial markets, with specialization in Forex and commodities markets.

More from Dhwani Mehta
Share:

Editor's Picks

EUR/USD accelerates losses, focus is on 1.1800

EUR/USD’s selling pressure is gathering pace now, opening the door to a potential test of the key 1.1800 region sooner rather than later. The pair’s pullback comes on the back of marked gains in the US Dollar following US data releases and the publication of the FOMC Minutes later in the day.

GBP/USD turns negative near 1.3540

GBP/USD reverses its initial upside momentum and is now adding to previous declines, revisiting at the same time the 1.3540 region on Wednesday. Cable’s downtick comes on the back of decent gains in the Greenback and easing UK inflation figures, which seem to have reinforced the case for a BoE rate cut in March.

Gold battle to regain $5,000 continues

Gold is back on the front foot on Wednesday, shaking off part of the early week softness and challenging two-day highs just above the key $5,000 mark per troy ounce. The move comes ahead of the FOMC Minutes and is unfolding despite an intense rebound in the US Dollar.

Fed Minutes to shed light on January hold decision amid hawkish rate outlook

The Minutes of the Fed’s January 27-28 monetary policy meeting will be published today. Details of discussions on the decision to leave the policy rate unchanged will be scrutinized by investors.

Mixed UK inflation data no gamechanger for the Bank of England

Food inflation plunged in January, but service sector price pressure is proving stickier. We continue to expect Bank of England rate cuts in March and June. The latest UK inflation read is a mixed bag for the Bank of England, but we doubt it drastically changes the odds of a March rate cut.

Sui extends sideways action ahead of Grayscale’s GSUI ETF launch

Sui is extending its downtrend for the second consecutive day, trading at 0.95 at the time of writing on Wednesday. The Layer-1 token is down over 16% in February and approximately 34% from the start of the year, aligning with the overall bearish sentiment across the crypto market.