- Slightly overbought RSI on the 1-hourly chart capped intraday positive move for USD/CAD.
- The set-up favours bulls and supports prospects for a further intraday appreciating move.
- A sustained breakthrough the 1.2650 horizontal support negate the constructive outlook.
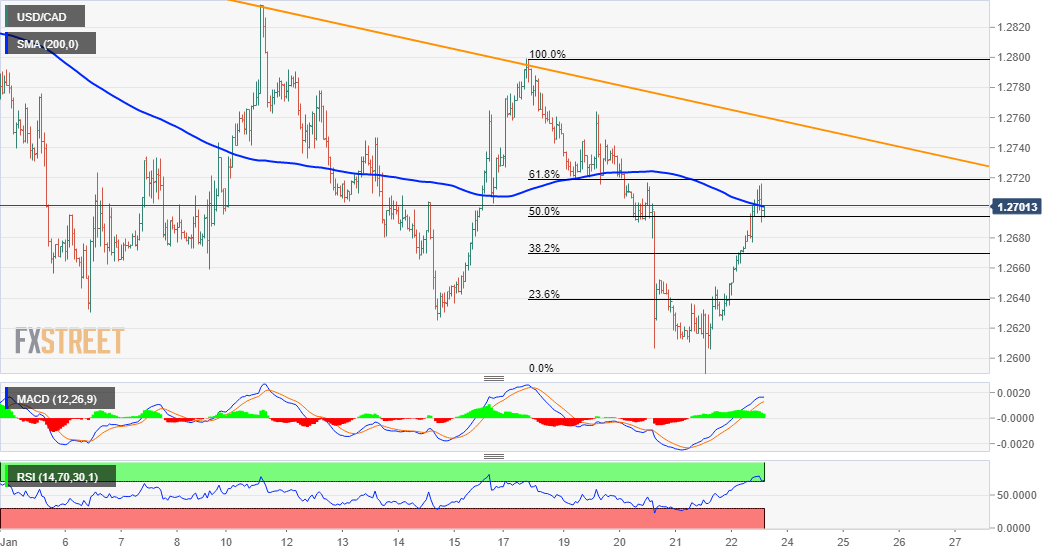
The USD/CAD pair stalled its intraday positive move near the 1.2715 area and quickly retreated few pips following the release of upbeat Canadian retail sales data. The mentioned region marks the 61.8% Fibonacci level of this week's rejection slide from the 1.2800 round-figure mark.
Slightly overbought RSI on the 1-hourly chart seemed to be the only factor that kept a lid on any further gains for the USD/CAD pair. That said, a sustained move beyond 200-hour SMA favours bullish traders and supports prospects for an extension of the recovery from multi-year lows.
The constructive outlook is further reinforced by the fact that oscillators on the 4-hourly chart have just started gaining bullish traction and recovered from the negative territory on the daily chart. Hence, a subsequent positive move back towards challenging a two-month-old descending trend-line resistance, currently around the 1.2765 region, now looks a distinct possibility.
Some follow-through buying has the potential to push the USD/CAD pair further towards the 1.2800 round-figure mark. The momentum could further get extended towards the 1.2835 region, above which bulls are likely to aim to conquer the 1.2900 round-figure mark.
On the flip side, the 38.2% Fibo. level, around the 1.2670 region, now seems to protect the downside. This is closely followed by horizontal support near mid-1.2600s, which if broken decisively will negate prospects for any further recovery and turn the USD/CAD pair vulnerable to slide further.
USD/CAD 1-hourly chart
Technical levels to watch
Information on these pages contains forward-looking statements that involve risks and uncertainties. Markets and instruments profiled on this page are for informational purposes only and should not in any way come across as a recommendation to buy or sell in these assets. You should do your own thorough research before making any investment decisions. FXStreet does not in any way guarantee that this information is free from mistakes, errors, or material misstatements. It also does not guarantee that this information is of a timely nature. Investing in Open Markets involves a great deal of risk, including the loss of all or a portion of your investment, as well as emotional distress. All risks, losses and costs associated with investing, including total loss of principal, are your responsibility. The views and opinions expressed in this article are those of the authors and do not necessarily reflect the official policy or position of FXStreet nor its advertisers. The author will not be held responsible for information that is found at the end of links posted on this page.
If not otherwise explicitly mentioned in the body of the article, at the time of writing, the author has no position in any stock mentioned in this article and no business relationship with any company mentioned. The author has not received compensation for writing this article, other than from FXStreet.
FXStreet and the author do not provide personalized recommendations. The author makes no representations as to the accuracy, completeness, or suitability of this information. FXStreet and the author will not be liable for any errors, omissions or any losses, injuries or damages arising from this information and its display or use. Errors and omissions excepted.
The author and FXStreet are not registered investment advisors and nothing in this article is intended to be investment advice.
Recommended content
Editors’ Picks
USD/JPY jumps above 156.00 on BoJ's steady policy

USD/JPY has come under intense buying pressure, surging past 156.00 after the Bank of Japan kept the key rate unchanged but tweaked its policy statement. The BoJ maintained its fiscal year 2024 and 2025 inflation forecast, disappointing the Japanese Yen buyers.
AUD/USD consolidates gains above 0.6500 after Australian PPI data

AUD/USD is consolidating gains above 0.6500 in Asian trading on Friday. The pair capitalizes on an annual increase in Australian PPI data. Meanwhile, a softer US Dollar and improving market mood also underpin the Aussie ahead of the US PCE inflation data.
Gold price keeps its range around $2,330, awaits US PCE data

Gold price is consolidating Thursday's rebound early Friday. Gold price jumped after US GDP figures for the first quarter of 2024 missed estimates, increasing speculation that the Fed could lower borrowing costs. Focus shifts to US PCE inflation on Friday.
Stripe looks to bring back crypto payments as stablecoin market cap hits all-time high

Stripe announced on Thursday that it would add support for USDC stablecoin, as the stablecoin market exploded in March, according to reports by Cryptocompare.
US economy: Slower growth with stronger inflation

The US Dollar strengthened, and stocks fell after statistical data from the US. The focus was on the preliminary estimate of GDP for the first quarter. Annualised quarterly growth came in at just 1.6%, down from the 2.5% and 3.4% previously forecast.