|

USD/CAD Price Analysis: Bullish wedge breakout in play, OPEC+ decision/Powell’s speech awaited

  • USD/CAD oscillated in a narrow trading range through the mid-European session.
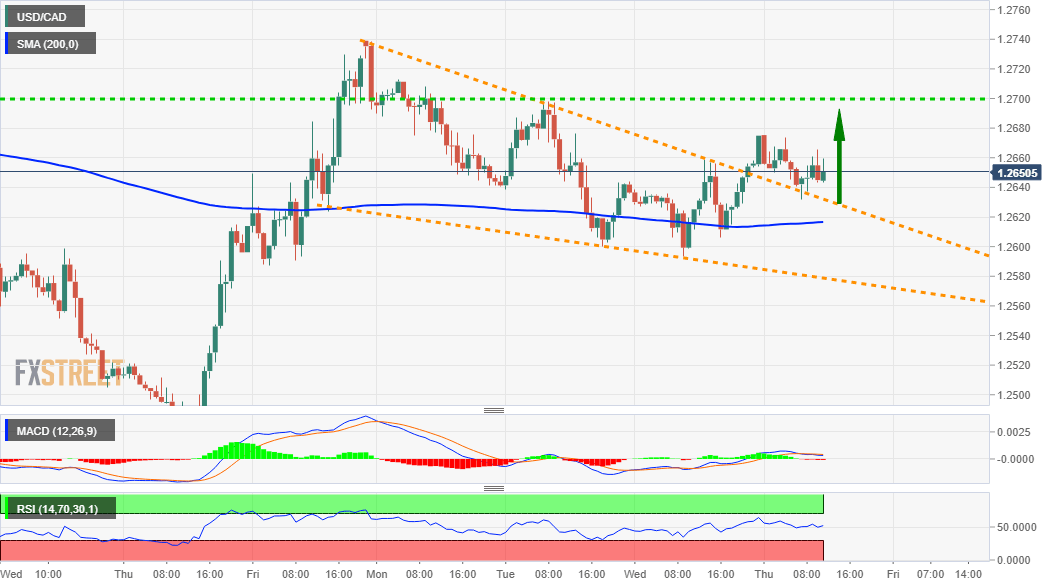
  • A breakout through a falling wedge pattern supports prospects for additional gains.
  • Bulls might aim for a move beyond the 1.2700 mark and test the 1.2745 supply zone.

The USD/CAD pair lacked any firm directional bias and seesawed between tepid gains/minor losses through the first half of the European session. The pair was last seen trading just above mid-1.2600s, nearly unchanged for the day. 

Strong follow-through US dollar buying was seen as a key factor that assisted the USD/CAD pair to attract some dip-buying near the 1.2630 region. Apart from this, a modest pullback in crude oil prices undermined the commodity-linked loonie and remained supportive. That said, investors preferred to wait for Fed Chair Jerome Powell's scheduled speech later during the North American session. This, along with nervousness ahead of the OPEC+ decision on production quotas, further held traders from placing directional bets.

From a technical perspective, the intraday downtick managed to find decent support near a four-day-old descending trend-line resistance breakpoint. The mentioned resistance-turned-support constituted the formation of a bullish falling wedge on short-term charts. Given that the USD/CAD pair, so far, has managed to find acceptance above the pattern resistance, the intraday bias seems tilted in favour of bullish traders. Hence, a move back towards weekly tops, around the 1.2700 mark, looks a distinct possibility.

Meanwhile, technical indicators on the daily chart have recovered from the negative territory and maintained their bullish bias on hourly charts. This, in turn, further supports prospects for an extension of the recent goodish bounce from multi-year lows. A sustained strength beyond the 1.2700 mark will reaffirm the constructive outlook and push the USD/CAD pair back towards the 1.2745 supply zone. Some follow-through buying should pave the way for a move towards reclaiming the 1.2800 round-figure mark.

On the flip side, the 1.2630 region might continue to protect the immediate downside. This is followed by the lower boundary of the wedge, around the 1.2600-1.2590 region, which if broken decisively will negate any near-term bullish bias. The USD/CAD pair might then turn vulnerable and accelerate the fall further towards challenging the key 1.2500 psychological mark.

USD/CAD 1-hourly chart

fxsoriginal

Technical levels to watch

USD/CAD

Overview
Today last price1.2656
Today Daily Change0.0009
Today Daily Change %0.07
Today daily open1.2647
 
Trends
Daily SMA201.2671
Daily SMA501.2717
Daily SMA1001.2866
Daily SMA2001.3118
 
Levels
Previous Daily High1.2659
Previous Daily Low1.2593
Previous Weekly High1.273
Previous Weekly Low1.2468
Previous Monthly High1.287
Previous Monthly Low1.2468
Daily Fibonacci 38.2%1.2634
Daily Fibonacci 61.8%1.2618
Daily Pivot Point S11.2607
Daily Pivot Point S21.2567
Daily Pivot Point S31.2541
Daily Pivot Point R11.2672
Daily Pivot Point R21.2698
Daily Pivot Point R31.2738

Author

Haresh Menghani

Haresh Menghani is a detail-oriented professional with 10+ years of extensive experience in analysing the global financial markets.

More from Haresh Menghani
Share:

Editor's Picks

AUD/USD falls to near 0.7100 after slipping below 50-day EMA

AUD/USD depreciates after registering minor gains in the previous day, trading around 0.7120 during the Asian hours. The technical analysis of the daily chart shows the pair consolidating sideways within a rectangle pattern, as neither bulls nor bears gain control. The AUD/USD pair is holding a slight bearish tone however as it sits beneath both the nine-day and 50-day EMAs.

160.00: USD/JPY back near intervention territory after upbeat US jobs report

US Nonfarm Payrolls beat expectations by a wide margin in May, with 172K jobs added. The US Dollar rebounds after the release, helping USD/JPY recover from its intraday lows. Warnings from Japanese authorities continue to limit upside potential near the 160.00 threshold.

Gold targets $4,300 amid stronger Dollar

Gold faces increasing selling interest and navigates the area of three-month lows near the $4,300 mark per troy ounce on Friday. The precious metal’s decline comes as traders assess the stronger-than-expected NFP, while the bid bias in the Greenback and higher US Treasury yields also collaborate with the retracement.

Cardano hits five-year low even as Hoskinson clarifies "break" isn't an exit

Cardano (ADA) price is down 10% at press time on Friday, extending losses over 30% so far this week amid Charles Hoskinson's clarification that "break" isn't an exit.

Week ahead – Fed countdown begins amid US inflation data and geopolitical risks

Fed Chair Warsh’s first meeting approaches as key US inflation data could reshape expectations. Oil prices remain elevated as US-Iran talks continue; tariffs also return to the spotlight. ECB is expected to hike; will it be a one-off move or is July live?

The US economy defies the rules: 100 days into the Oil shock and the recession signal is still missing

More than three months after the start of the Iran war and the resulting disruption to global energy markets, the US economy continues to display remarkable resilience. The conflict has triggered a sharp rise in Oil prices, reignited inflationary pressures and fueled widespread concerns about a potential economic slowdown.