|

USD/CAD Price Analysis: Broadening formation and bullish extremes point to lower

  • USD/CAD's broadening formation on the daily chart is compelling.
  • USD/CAD could be on the verge of a significant move lower.

USD/CAD has moved in on a monthly price imbalance to fill the void which raises the prospects of a move lower according to lower time frame broadening formations as illustrated in the following charts:

USD/CAD monthly chart
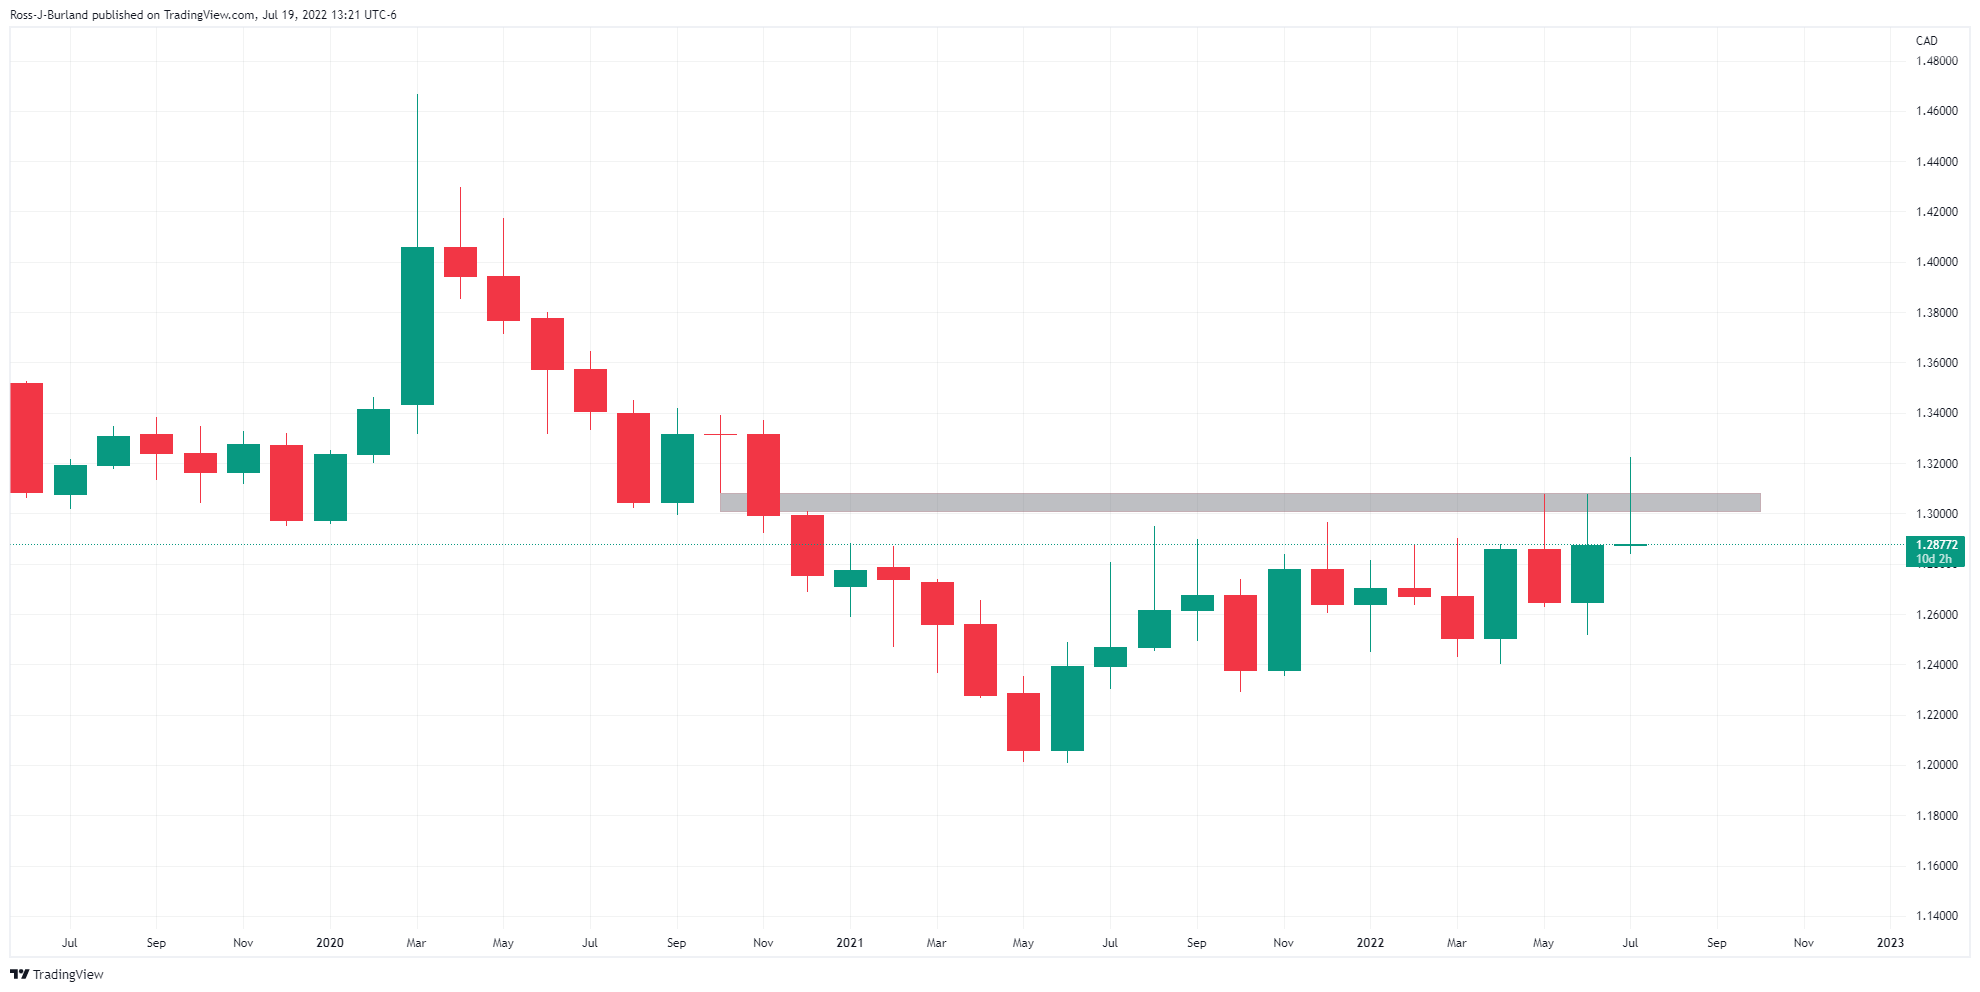
The wicks on the last few months not only represent a price extreme on lower time frames but have mitigated a price imbalance from the November 2020 supply. This leaves scope for a move to the downside for the foreseeable weeks and days ahead. 

USD/CAD daily chart
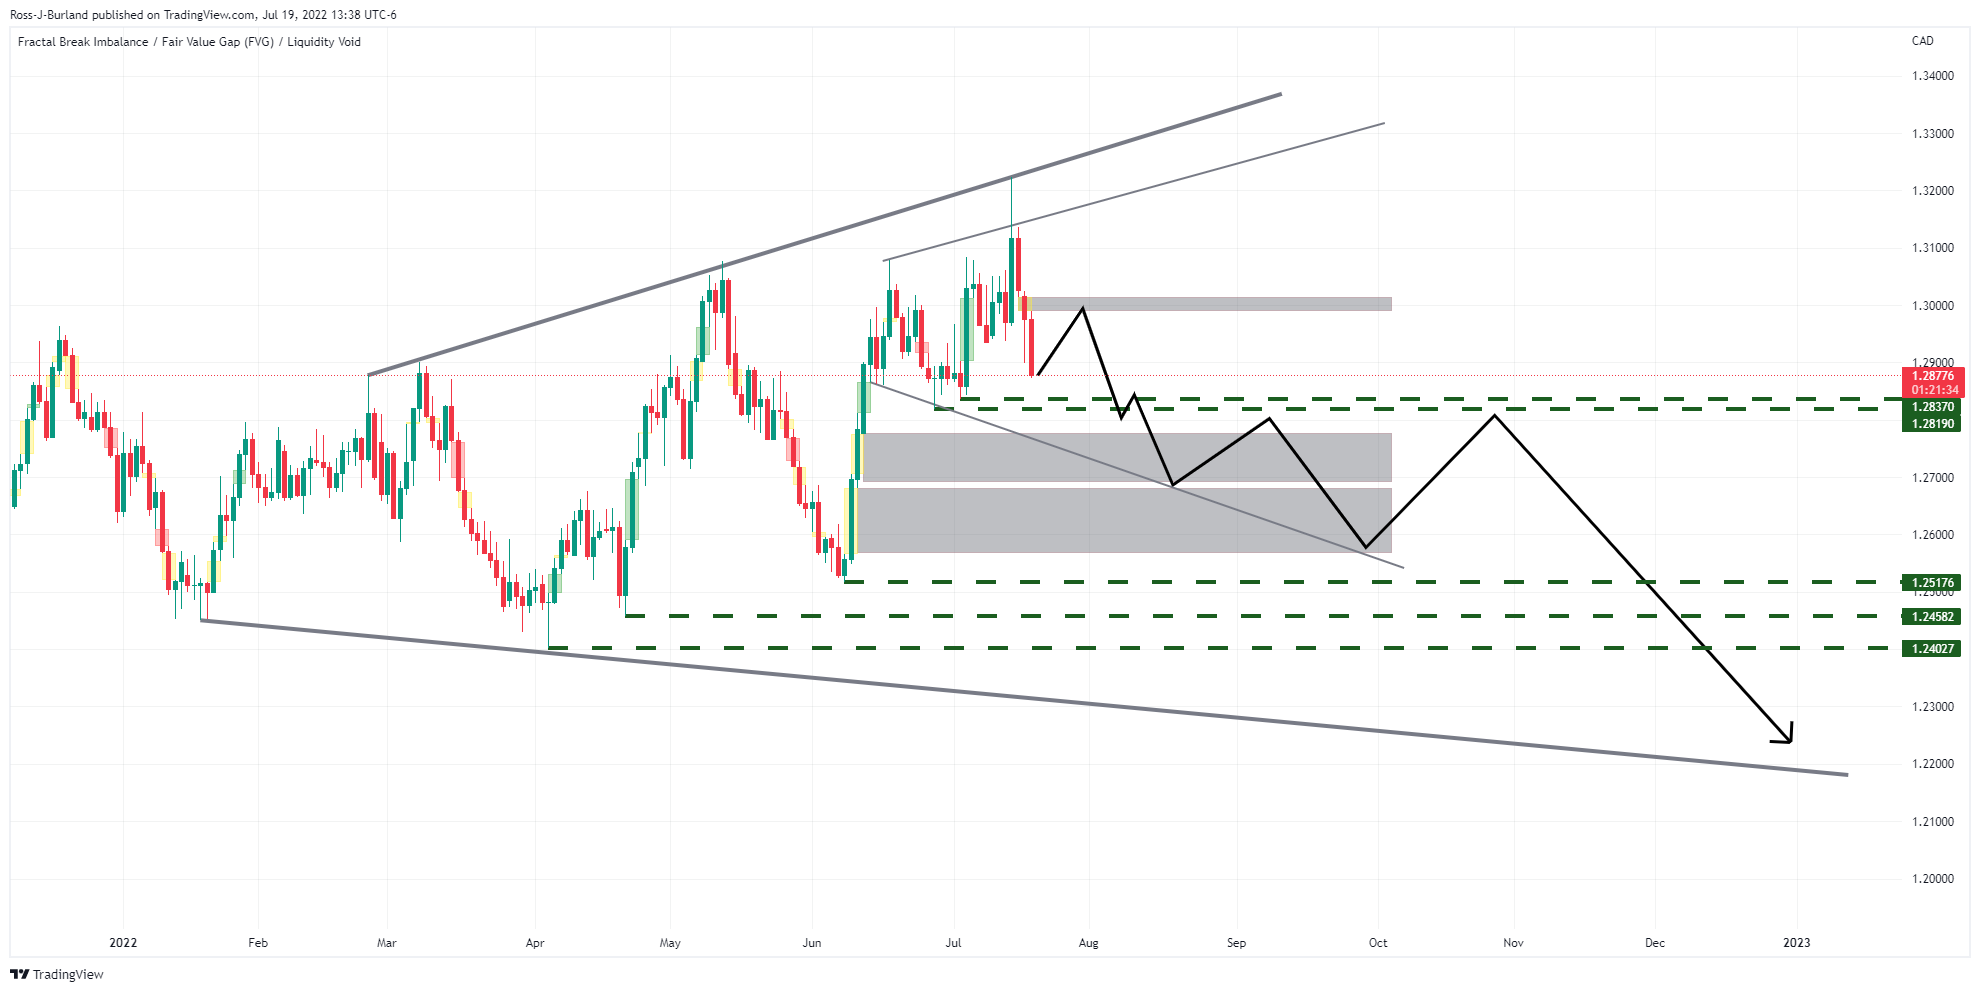
As illustrated above, the increasing price volatility can be shown as two diverging trend lines, one rising and one falling and here we have a broadening formation within another. The great areas are price imbalances that would be expected to be mitigated in time to come. The emphasis in the diagram above is to the downside with price exhaustion at the top of the expanding range and volatility and a void of price action to the downside.

The pivot points at 1.2837 and 1.2819 could be important for the days ahead. If they were to give way, then the focus will be on mitigation of the price imbalance from the bullish impulse. This leaves 1.26 the figure vulnerable for the days ahead. The pivots thereafter will be critical in defending against an expansion of the price below 1.2400. 

Author

Ross J Burland

Ross J Burland, born in England, UK, is a sportsman at heart. He played Rugby and Judo for his county, Kent and the South East of England Rugby team.


More from Ross J Burland
Share:

Editor's Picks

AUD/USD holds firm near 0.7000 after Chinese inflation, trade data

AUD/USD stays firm near 0.7000 in Wednesday’s Asian session, picking up some bids after China's mixed inflation and upbeat trade data. CPI rose less than expected in September, while PPI inflation picked up. Meanwhile, the Chinese trade surplus unexpectedly widened in September. The pair remains underpinned by a broadly subdued US Dollar, despite the Middle East escalation, as focus remains on US CPI data.

USD/JPY consolidates near 158.50; looks to US CPI for fresh impetus

USD/JPY stays range-bound near 158.50 in the Asian session on Wednesday, with looming intervention risks supporting the Japanese Yen and capping upside amid a softer US Dollar. However, geopolitical uncertainties act as a tailwind for the safe-haven USD and the pair. Traders also seem hesitant ahead of the release of the latest US inflation figures.

Gold extends slide below $4,100 after hot US inflation

Gold extends losses in the American session on Wednesday, following the release of hotter-than-anticipated US CPI. The CPI figure shows that September inflation rose 3.7% YoY, boosting demand for the US Dollar and weighing on the bright metal.

XRP recovery faces headwinds despite Ripple and Meritz Securities' tokenization push in Korea

XRP trades above $1.36 as bulls gather momentum to face a critical supply range toward $1.40. Ripple and Meritz Securities partner to explore institutional custody and tokenization services for South Korea’s capital markets.

A historic Treasury rout is underway. Investors are buying it at record size

Long-term Treasury yields climbed to their highest since 2002 in early October, and investors are taking record shares of the government's new debt at auction. The selling is coming from investors protecting other bets, not from buyers walking away.

Has Bitcoin really escaped the macro forces it was built to fight?
Over 17 years ago, Satoshi Nakamoto designed Bitcoin (BTC) on the back of a global financial crisis as an alternative to the global monetary system outside the control of central banks, governments and traditional intermediaries. This raises a key question: has Bitcoin really become independent of the macroeconomic forces it was built to challenge?