USD/CAD Price Analysis: 50-SMA tests sellers above 1.2700
- USD/CAD remains pressured on breaking weekly support line after two-day downtrend.
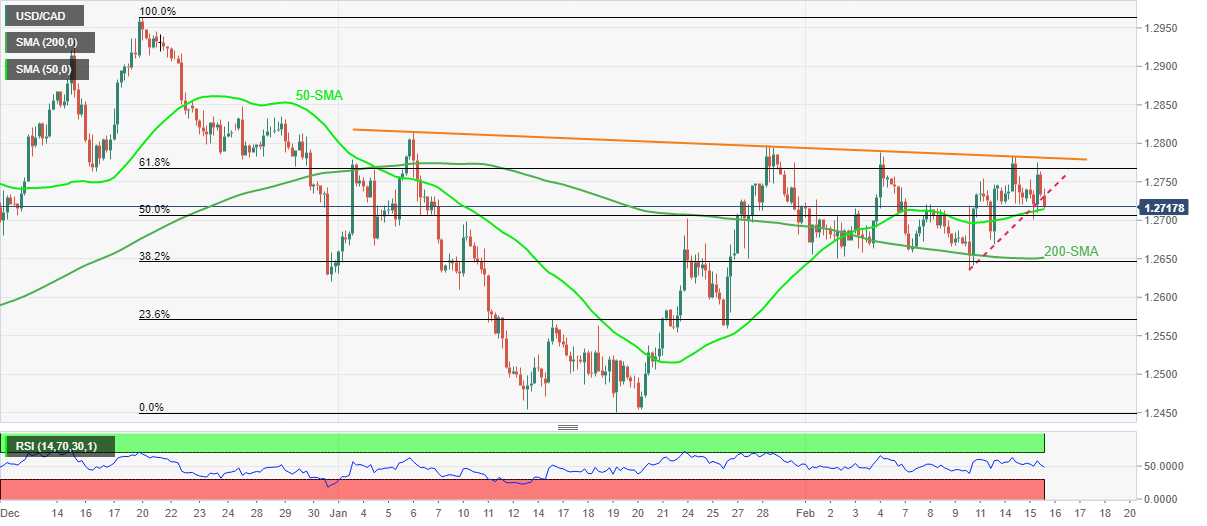
- Steady RSI, failures to cross six-week-old resistance line keep bears hopeful.
- 200-SMA becomes the key support, 61.8% Fibonacci retracement adds to upside filters.

USD/CAD remains on the back foot around 1.2720 during Wednesday’s initial Asian session, keeping the previously downbeat tone with reservations.
After multiple failures to cross a downward sloping trend line from January 06, the Loonie pair broke a one-week-old rising support line the previous day. The bearish bias also gains support from the RSI line.
However, a clear downside break of the 50-SMA level, around 1.2715 by the press time, becomes necessary for the USD/CAD sellers.
Also acting as a downside filter is the 50% Fibonacci retracement (Fibo.) of December 2021 to January 2022 downside, around 1.2705, as well as the 1.2700 threshold.
Should the pair bears dominate past 1.2700, the 200-SMA level around 1.2650 will regain the market’s attention.
Alternatively, the corrective pullback may initially battle the support-turned-resistance line around 1.2730 ahead of challenging the 61.8% Fibo. level close to 1.2770.
Though, USD/CAD bulls remain unconvinced before witnessing a clear upside break of the aforementioned six-week-old resistance line, close to 1.2785.
USD/CAD: Four-hour chart
Trend: Further weakness expected
Author

Anil Panchal
FXStreet
Anil Panchal has nearly 15 years of experience in tracking financial markets. With a keen interest in macroeconomics, Anil aptly tracks global news/updates and stays well-informed about the global financial moves and their implications.


