|

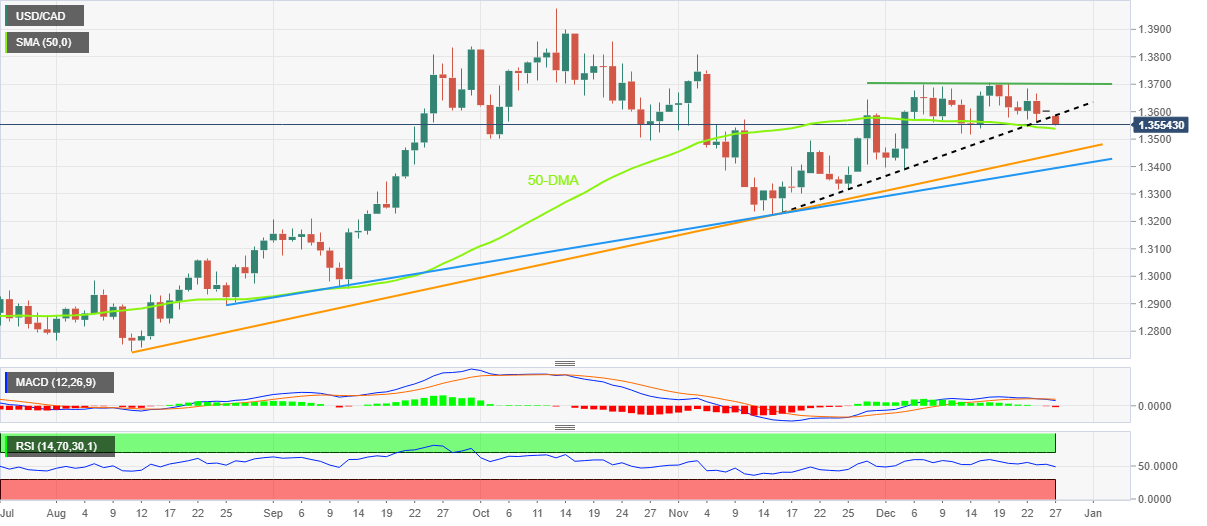
USD/CAD Price Analysis: 50-DMA probes immediate downside above 1.3500

  • USD/CAD takes offers after breaking six-week-old ascending trend line support, now resistance.
  • The first bearish MACD signal in a month, RSI retreat suggests further downside.
  • 50-DMA challenges bears targeting ascending support line from August.
  • Bulls need validation from 1.3700 to retake control.

USD/CAD extends the previous day’s bearish move while breaking the short-term key support during early Tuesday. That said, the Loonie pair refreshes intraday low near 1.3545 by the press time.

Not only a downside break of the six-week-old ascending trend line but the biggest bearish MACD signal in a month also favor the USD/CAD sellers. On the same line could be the recently softer RSI (14), not oversold.

As a result, the pair bears are all set to conquer the 50-DMA support of 1.3537, which in turn could direct the south-run towards an upward-sloping support line from August 11, close to 1.3440 by the press time.

In a case where the USD/CAD bears keep the reins past 1.3440, a four-month-long ascending support line, close to 1.3390 at the latest, will act as the last defense of the bulls, a break of which could quickly drag the quote toward the previous monthly low surrounding 1.3225.

Meanwhile, the support-turned-resistance line from mid-November, around 1.3585, challenges the USD/CAD pair’s immediate recovery moves.

Following that, a three-week-long horizontal resistance area near the 1.3700 round figure will be crucial for the bulls, as successful trading beyond the stated hurdle won’t hesitate to cross November’s peak of 1.3808.

USD/CAD: Daily chart

Trend: Further downside expected

Additional important levels

Overview
Today last price1.355
Today Daily Change-0.0054
Today Daily Change %-0.40%
Today daily open1.3604
 
Trends
Daily SMA201.3593
Daily SMA501.3541
Daily SMA1001.3414
Daily SMA2001.3101
 
Levels
Previous Daily High1.3604
Previous Daily Low1.3604
Previous Weekly High1.3704
Previous Weekly Low1.3563
Previous Monthly High1.3808
Previous Monthly Low1.3226
Daily Fibonacci 38.2%1.3604
Daily Fibonacci 61.8%1.3604
Daily Pivot Point S11.3604
Daily Pivot Point S21.3604
Daily Pivot Point S31.3604
Daily Pivot Point R11.3604
Daily Pivot Point R21.3604
Daily Pivot Point R31.3604

Author

Anil Panchal

Anil Panchal

FXStreet

Anil Panchal has nearly 15 years of experience in tracking financial markets. With a keen interest in macroeconomics, Anil aptly tracks global news/updates and stays well-informed about the global financial moves and their implications.

More from Anil Panchal
Share:

Markets move fast. We move first.

Orange Juice Newsletter brings you expert driven insights - not headlines. Every day on your inbox.

By subscribing you agree to our Terms and conditions.

Editor's Picks

EUR/USD: Bulls pray for a dovish Fed

EUR/USD has finally taken a breather after a pretty energetic climb. The pair broke above 1.1680 in the second half of the week, reaching its highest levels in around two months before running into some selling pressure. Even so, it has gained almost two cents from the late-November dip just below 1.1500 the figure.

GBP/USD trims gains, recedes toward 1.3320

GBP/USD is struggling to keep its daily advance, coming under fresh pressure and retreating to the 1.3320 zone following a mild bullish attempt in the Greenback. Even though US consumer sentiment surprised to the upside, the US Dollar isn’t getting much love, as traders are far more interested in what the Fed will say next week.

Gold: Bullish momentum fades despite broad USD weakness

After rising more than 3.5% in the previous week, Gold has entered a consolidation phase and fluctuated at around $4,200. The Federal Reserve’s interest rate decision and revised Summary of Economic Projections, also known as the dot plot, could trigger the next directional move in XAU/USD. 

Week ahead: Rate cut or market shock? The Fed decides

Fed rate cut widely expected; dot plot and overall meeting rhetoric also matter. Risk appetite is supported by Fed rate cut expectations; cryptos show signs of life. RBA, BoC and SNB also meet; chances of surprises are relatively low. Dollar weakness could linger; both the aussie and the yen best positioned to gain further. Gold and oil eye Ukraine-Russia developments; a peace deal remains elusive.

The Silver disconnection is real

Silver just hit a new all-time high. Neither did gold, nor mining stocks. They all reversed on an intraday basis, but silver’s move to new highs makes it still bullish overall, while the almost complete reversals in gold and miners make the latter technically bearish.

Ripple faces persistent bear risks, shrugging off ETF inflows

Ripple is extending its decline for the second consecutive day, trading at $2.06 at the time of writing on Friday. Sentiment surrounding the cross-border remittance token continues to lag despite steady inflows into XRP spot ETFs.