|

USD/CAD finds support above 1.2820, heads for a weekly loss

  • SD/CAD bounces from weekly lows back to 1.2870.
  • Data from Canada surpass expectations, while in US disappoints.
  • Attentions turn to FOMC meeting next week.
USD/CAD finds support above 1.2820, heads for a weekly loss

The USD/CAD is about to the week hovering around 1.2870 after rebounding from the 1.2820. Still the US dollar is about to end the week on a negative tone ahead of the FOMC meeting.

Economic data

The greenback tumbled after the release of the S&P Global PMI report that showed an unexpected contraction in the service sector in July according to preliminary data. The figures boosted further Treasuries and weighed on the US dollar. Attention now turns to next week’s FOMC meeting.

In Canada, data showed retail sales rose above market consensus in May with an increase of 2.2% and the preliminary estimate for June point to a gain of 0.3%. Although the numbers did not help the loonie that pulled back as stocks in Wall Street dropped further.

Key support holds

The USD/CAD rebounded after approaching the critical support area of 1.2820 and even recovered levels above the other relevant support of 1.2850, leaving the pair back into the previous range.

On a weekly basis, USD/CAD is about to end the week with losses after being unable to break the 1.3020 resistance. The wide range between 1.2850 and 1.3020 still prevails.

“The CAD has rebounded over the past week resulting in USD/CAD dropping back below the 1.2900 supported by the rebound in global equity markets. USD/CAD has had one of the strongest correlations with global equity market performance amongst G10 FX pairs. At the current juncture we view this equity market rebound as most likely a bear market rebound. As a result, the correction lower for USD/CAD should prove limited and short-lived”, consider analysts at MUFG Bank.
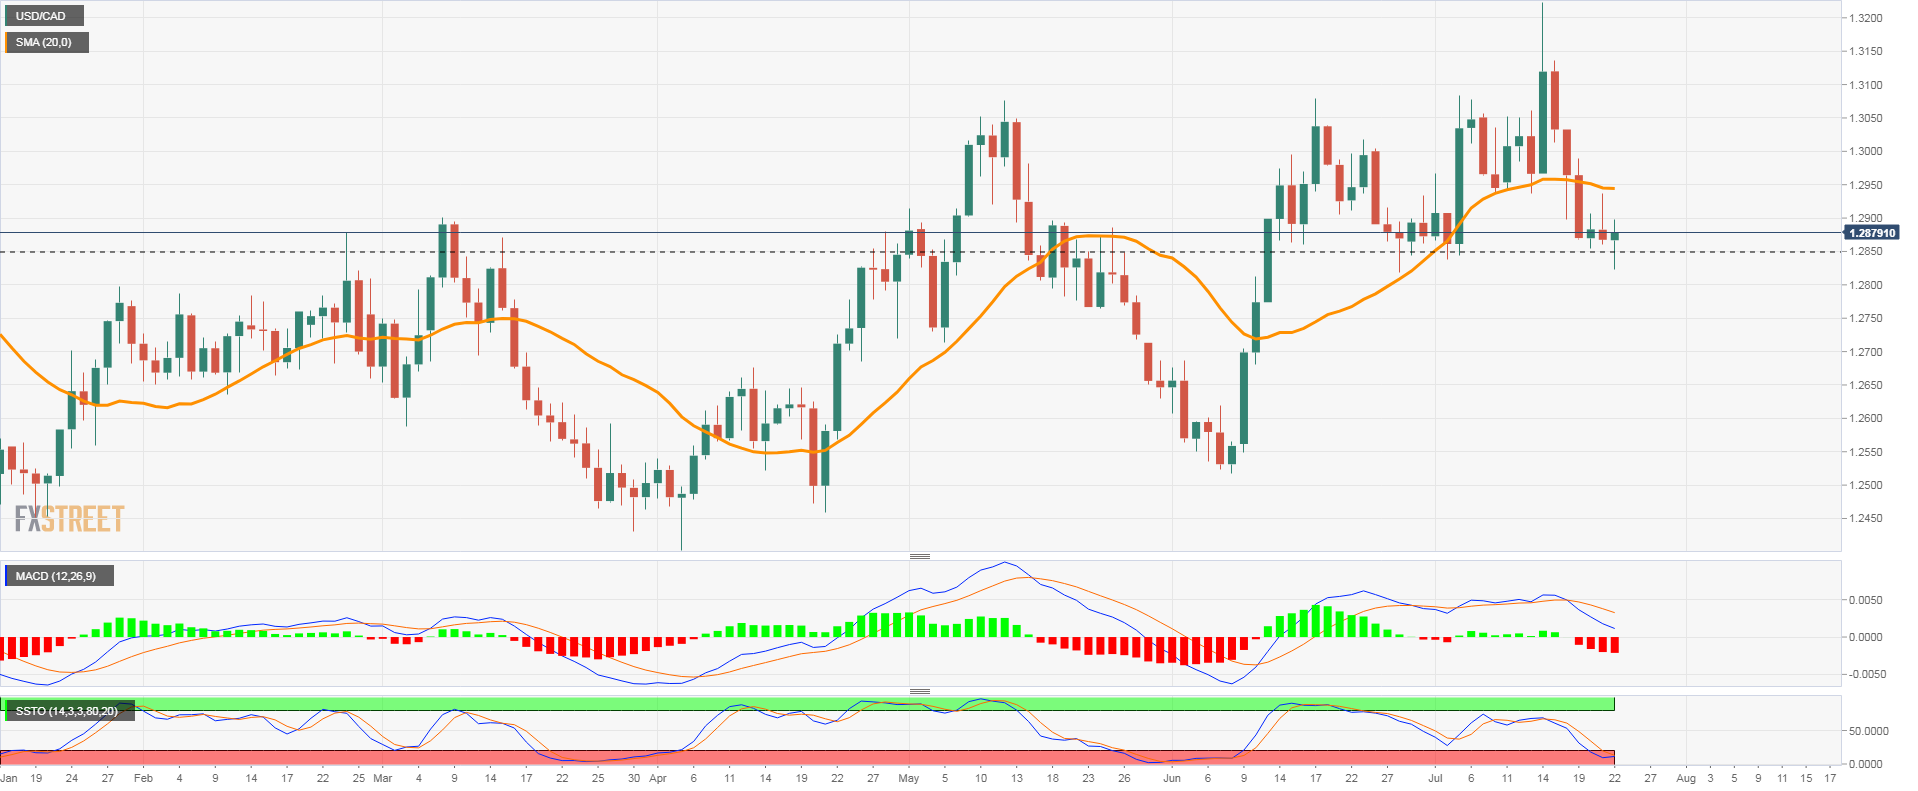
USDCAD

Technical levels

USD/CAD

Overview
Today last price1.2875
Today Daily Change0.0007
Today Daily Change %0.05
Today daily open1.2868
 
Trends
Daily SMA201.2945
Daily SMA501.2856
Daily SMA1001.2773
Daily SMA2001.2709
 
Levels
Previous Daily High1.2937
Previous Daily Low1.286
Previous Weekly High1.3224
Previous Weekly Low1.2936
Previous Monthly High1.3079
Previous Monthly Low1.2518
Daily Fibonacci 38.2%1.2889
Daily Fibonacci 61.8%1.2907
Daily Pivot Point S11.2839
Daily Pivot Point S21.2811
Daily Pivot Point S31.2762
Daily Pivot Point R11.2916
Daily Pivot Point R21.2965
Daily Pivot Point R31.2993

Author

Matías Salord

Matías started in financial markets in 2008, after graduating in Economics. He was trained in chart analysis and then became an educator. He also studied Journalism. He started writing analyses for specialized websites before joining FXStreet.


More from Matías Salord
Share:

Editor's Picks

AUD/USD bears retain control near YTD low, 0.6650 tested

AUD/USD sits at fresh YTD lows near 0.6550 in Friday's Asian session and looks vulnerable to further downside. The US Dollar holds near April 2025 highs amid renewed US-Iran tensions and aggressive Fed rate-hike bets. Moreover, Thursday’s dismal Aussie jobs data, the RBA’s dovish tilt and PBOC's status-quo continue to weigh on the Aussie, validating the negative outlook for the currency pair.

USD/JPY drops below 159.50 after Japan’s National CPI

USD/JPY has turned south below mid-159.00s in the Asian session on Friday, as the Japanese Yen gains ground following the country's National CPI, which reaffirmed the December BoJ rate hike. Further, a broader risk-off market environment lifts the Yen's safe-haven appeal. However, hawkish Fed outlook and renewed US-Iran tensions keep the US Dollar supported, which could limit the pair's downside.


Gold: The $3,500 zone holds the downside… for now

Gold further extends its deep pullback, coming close to the key $3,500 mark per troy ounce as Friday’s European session draws to a close. Furthermore, the yellow metal has traded with losses since Monday, always tracking rising bets for extra tightening by the Fed and the lack of any progress from the Middle East conflict.

Bitcoin slips below $60,000 as selling pressure accelerates

Bitcoin price slips below $60,000 on Friday, reaching a level not seen since early July. Momentum indicators suggest firm selling pressure despite reaching oversold levels.

Week ahead – Flash PMIs and PCE inflation in focus ahead of Thanksgiving

US flash PMIs and PCE inflation data could shape Fed rate expectations. Eurozone and UK PMIs will offer an early look at business activity. Australia’s CPI data could influence expectations for the RBA’s next move.

Gold's 14-month low looks mild next to Silver's fall from $121 to $44
Gold has lost a third of its value since January as traders bet on more Federal Reserve rate increases. Silver has lost nearly two-thirds, because the buyers still holding Gold up have no equivalent in the Silver market. Gold is trading below $3,700 for the first time since September 2025, a little more than a third under the record near $5,600 it set in late January.















