|

US Dollar Index track T-bond yields to bounce off 50-SMA

  • DXY consolidates the previous day’s pullback from three-month high.
  • US Treasury yields rebound from February lows amid covid concerns.
  • Rising wedge near the multi-day top keeps buyers cautious.

US dollar index (DXY) seesaws around 92.40, up 0.05% intraday, amid early Friday. In doing so, the greenback gauge tracks the Treasury yields’ bounce off multi-day lows amid the coronavirus (COVID-19) concerns.

The US 10-year Treasury yield regains 1.31%, up 2.6 basis points (bps) while the 30-year counterpart jumps back from early February levels to 1.94%, adding three bps by the press time.

Although Aussie Prime Minister Scott Morrison changed his stance over the AstraZeneca vaccine, also pushed people to take early jabs of Pfizer, Australia’s covid infections jumped to three days high on July 08. On the other hand, UK refreshed the six-month high of the virus cases, unfortunately, whereas the numbers as grim for Indonesia, South Korea and Thailand.

It’s worth noting that the previous day’s higher than expected weekly Jobless Claims couldn’t entertain market players as the European Central Bank’s (ECB) readiness to stay flexible with the inflation target was in the spotlight, as far as the ex-covid concerns are noted.

Moving on, a light calendar keeps risk catalysts in the focus for fresh impulse.

Technical analysis

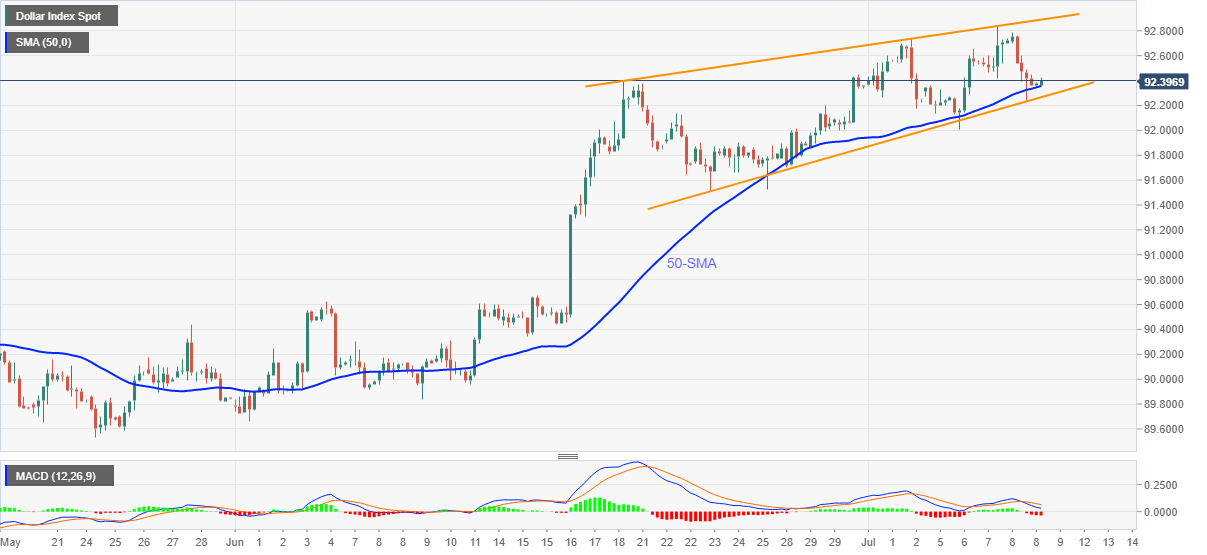
DXY registers a corrective pullback from 50-SMA but downbeat MACD signals challenge the recovery moves.

Also probing the US dollar index optimists is the rising wedge bearish chart pattern near the highest since April.

Hence, the recovery moves need to defy the wedge formation with an upside break of 92.90 to keep the DXY bulls hopeful. Also acting as the key hurdle is the 93.00 threshold.

Meanwhile, a downside break of 92.25 will confirm the bearish pattern suggesting the dollar index weakness towards late June lows surrounding 91.50.

It’s worth noting that the quote’s weakness past 91.50 will be crucial as any further drop under 91.30 should recall early June tops close to 90.60 back the chart.

DXY: Four-hour chart

Trend: Pullback expected

Additional important levels

Overview
Today last price92.41
Today Daily Change0.04
Today Daily Change %0.04%
Today daily open92.37
 
Trends
Daily SMA2091.86
Daily SMA5090.91
Daily SMA10091.28
Daily SMA20091.4
 
Levels
Previous Daily High92.79
Previous Daily Low92.24
Previous Weekly High92.74
Previous Weekly Low91.7
Previous Monthly High92.45
Previous Monthly Low89.66
Daily Fibonacci 38.2%92.45
Daily Fibonacci 61.8%92.58
Daily Pivot Point S192.14
Daily Pivot Point S291.92
Daily Pivot Point S391.6
Daily Pivot Point R192.69
Daily Pivot Point R293.01
Daily Pivot Point R393.24

Author

Anil Panchal

Anil Panchal

FXStreet

Anil Panchal has nearly 15 years of experience in tracking financial markets. With a keen interest in macroeconomics, Anil aptly tracks global news/updates and stays well-informed about the global financial moves and their implications.

More from Anil Panchal
Share:

Editor's Picks

EUR/USD risks a deeper drop below 1.1750

EUR/USD keeps its vacillating mood in place as the the NA session drwas to a close on Tuesday, hovering below the 1.1800 hurdle amid acceptable gains in the US Dollar. In the meantime, market participants and the FX galaxy are expected to closely follow President Trump’s SOTU speech around 2AM GMT.
 

GBP/USD regains 1.3500 and above

GBP/USD extends its advance for the third day in a row on Tuesday, this time retesting the area beyond the 1.3500 hurdle. Cable’s uptick comes despite decent gains in the Greenback and the dovish message from the BoE’s Bailey at the UK Parliament.

Gold appears offered around $5,150

Gold is giving back a good portion of the recent multi-day rally, receding to the $5,150 zone per troy ounce amid the decent bounce in the US Dollar and mixed US Treasuty yields. In the meantime, markets’ attention remain on upcoming comments from Fed speakers.

Ripple’s DeFi shift in focus: Navigating XRPL EVM sidechain growth, XRPFi migration and liquidity
Ripple (XRP) has continued to trade under pressure, extending its decline by approximately 63% from the record high of $3.66 in July. The remittance token is trading above support at $1.35, while its upside appears limited by key supply zones, starting with $1.40, at the time of writing on Tuesday.
The Citrini report: How a debatable AI narrative can shake Wall Street

That AI-related headline alone was enough to rattle investors.US stocks slid sharply on Monday after a widely circulated Citrini Research memo outlined a hypothetical “2028 Global Intelligence Crisis”, warning that rapid AI adoption could push US unemployment into double digits as early as by mid-2028.

XRP pressured by weak ETF flows and declining retail interest

Ripple (XRP) is edging lower, trading above its intraday low of $1.32 at the time of writing on Tuesday. The decline from its weekly opening of $1.39 reflects heightened volatility in the broader cryptocurrency market, accentuated by tariff-triggered uncertainty.