|

US Dollar Index technical analysis: DXY in wait-and-see mode, ending the day virtually unchanged near the 97.55 level

  • DXY has been directionless this Wednesday as the market is weighing the impact of the trade war on US interest rates. 
  • Wall Street indices are about to end the day near daily highs giving some support to the buck.
  • The level to beat for bulls are seen at 97.80, followed by 98.10 and 98.38 resistances. 
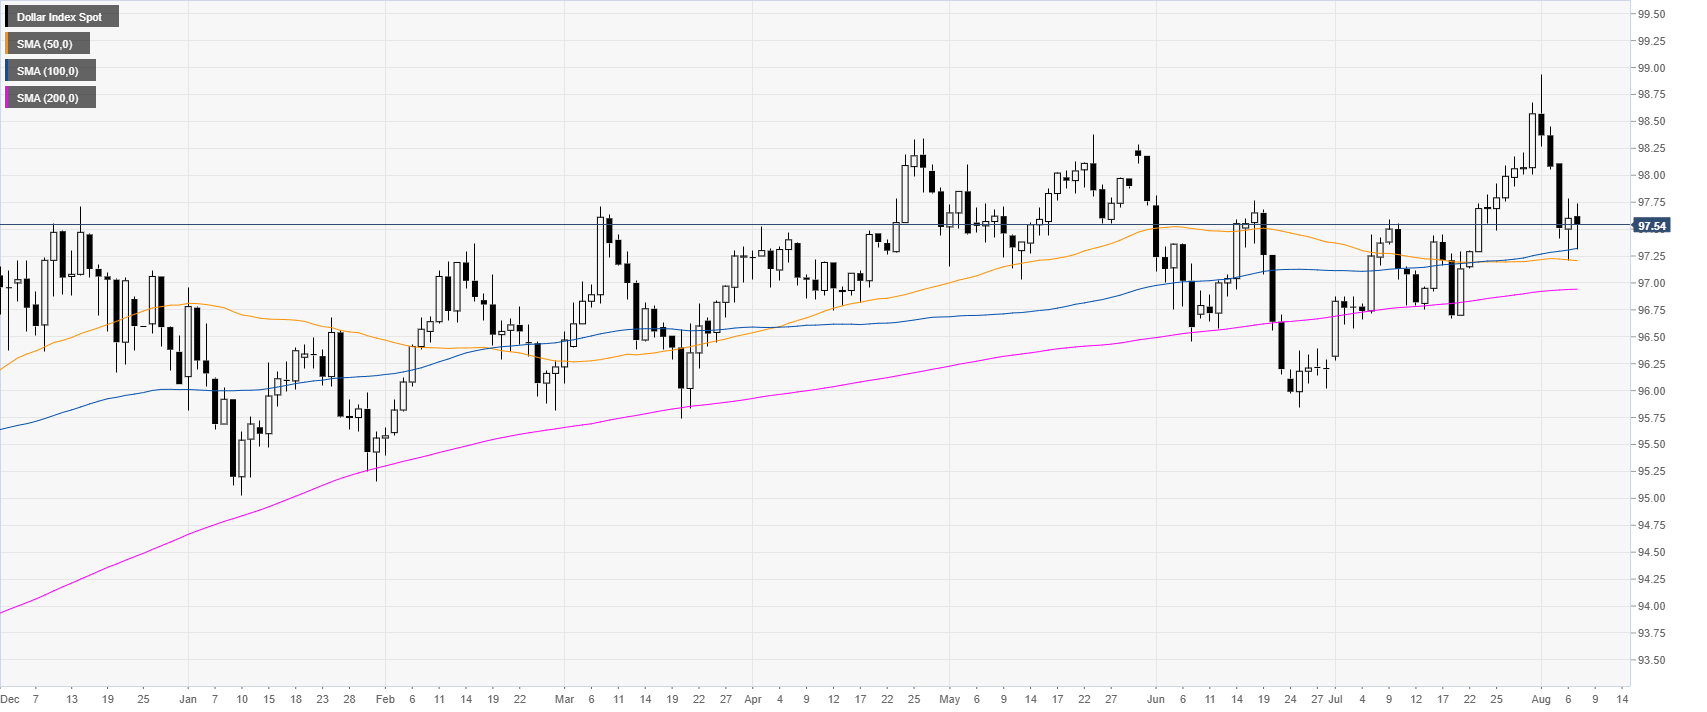


DXY daily chart

 
DXY (US Dollar Index) is trading in a bull trend above its main daily simple moving averages (DSMAs). The greenback remains fragile as the threat of the US-China trade war keeps looming. US stock indices are currently trading near their daily highs somewhat supporting DXY for the time being.
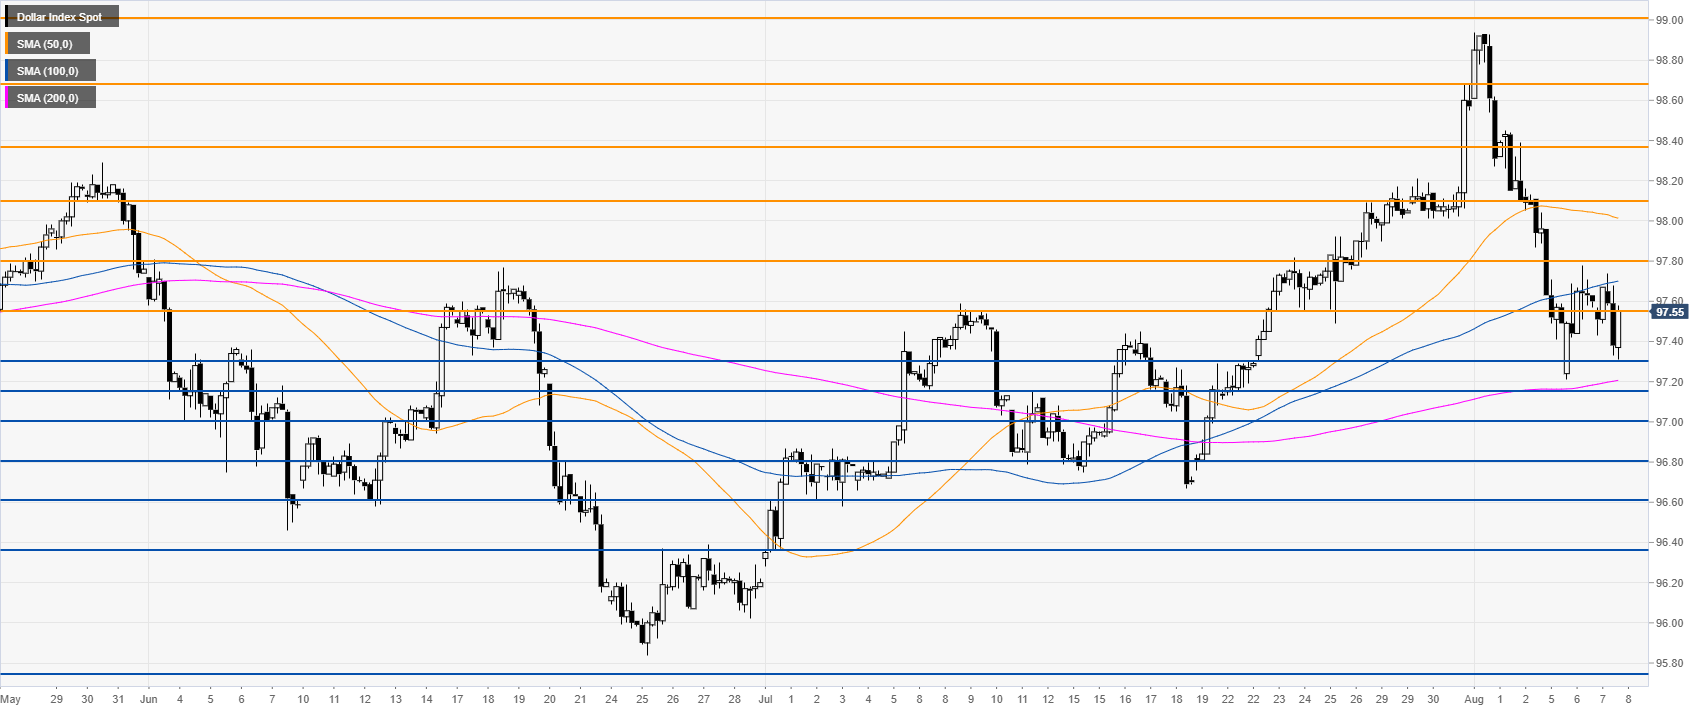
 

DXY 4-hour chart


DXY found support at the 96.30 support above the 200 SMA, creating a small double bottom. The bulls need a clear breakout above to 97.80 resistance to recapture the 98.10 level near the 50 SMA followed by 98.36 resistance.
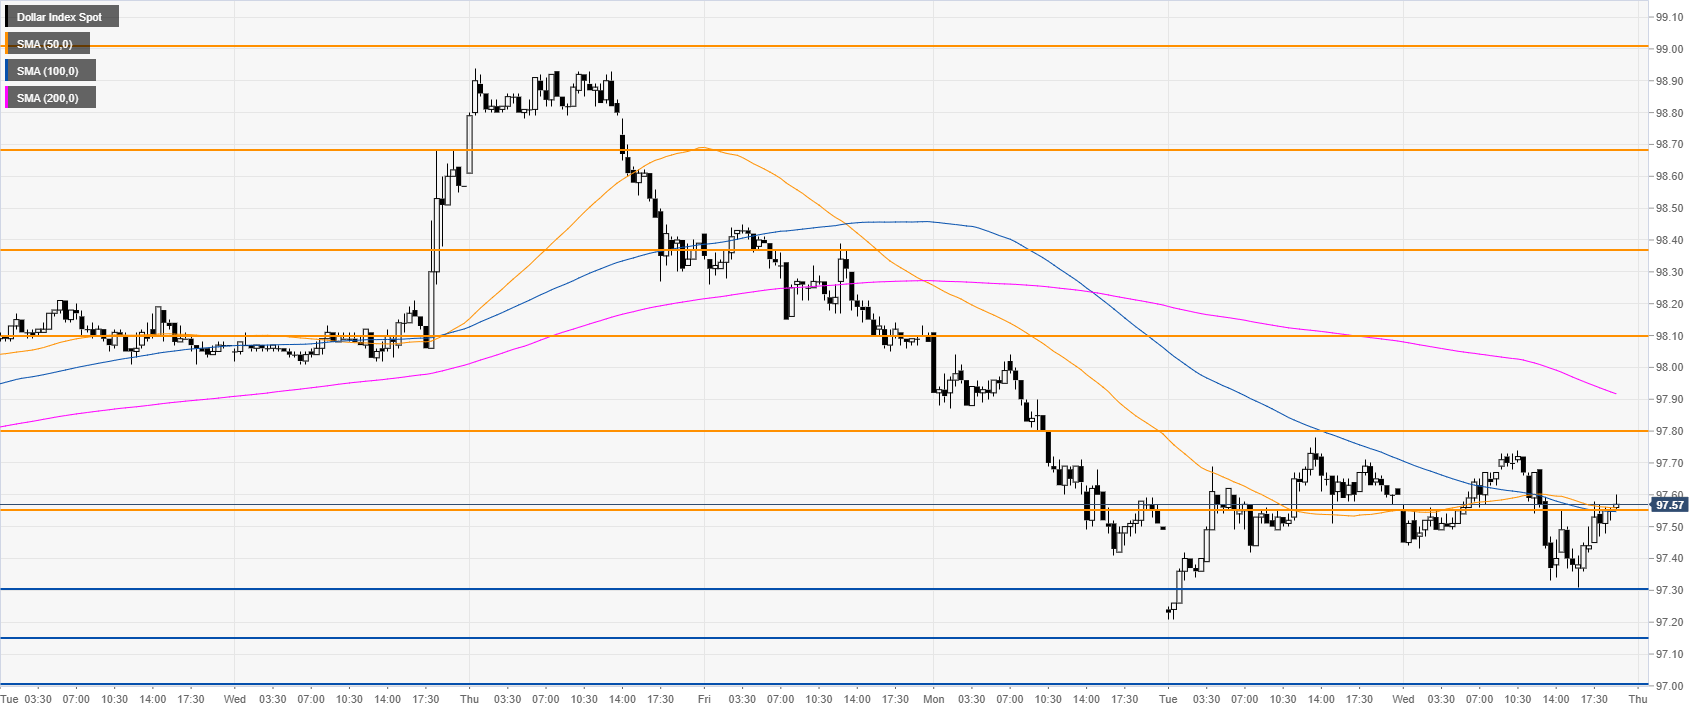
 

DXY 30-minute chart

 
The greenback has been consolidating its recent losses for the second consecutive day. A daily close below 97.15 would be seen as a potential bearish continuation towards the 97.00 figure. 


Additional key levels

Dollar Index Spot

Overview
Today last price97.55
Today Daily Change-0.05
Today Daily Change %-0.05
Today daily open97.6
 
Trends
Daily SMA2097.56
Daily SMA5097.21
Daily SMA10097.31
Daily SMA20096.94
Levels
Previous Daily High97.78
Previous Daily Low97.21
Previous Weekly High98.94
Previous Weekly Low97.9
Previous Monthly High98.68
Previous Monthly Low96.28
Daily Fibonacci 38.2%97.56
Daily Fibonacci 61.8%97.43
Daily Pivot Point S197.28
Daily Pivot Point S296.96
Daily Pivot Point S396.71
Daily Pivot Point R197.85
Daily Pivot Point R298.1
Daily Pivot Point R398.42

Author

Flavio Tosti

Flavio Tosti

Independent Analyst


More from Flavio Tosti
Share:

Editor's Picks

EUR/USD looks apathetic around 1.1770

EUR/USD comes under renewed pressure on Tuesday, deflating below the 1.1800 support and reversing two consecutive days of gains. The pair’s decline follows the persistent move higher in the US Dollar, as trade uncertainty dominates the sentiment ahead of President Trump’s SOTU speech.

GBP/USD regains 1.3500 and above

GBP/USD extends its advance for the third day in a row on Tuesday, this time retesting the area beyond the 1.3500 hurdle. Cable’s uptick comes despite decent gains in the Greenback and the dovish message from the BoE’s Bailey at the UK Parliament.

Gold appears offered around $5,150

Gold is giving back a good portion of the recent multi-day rally, receding to the $5,150 zone per troy ounce amid the decent bounce in the US Dollar and mixed US Treasuty yields. In the meantime, markets’ attention remain on upcoming comments from Fed speakers.

Ripple’s DeFi shift in focus: Navigating XRPL EVM sidechain growth, XRPFi migration and liquidity

Ripple (XRP) has continued to trade under pressure, extending its decline by approximately 63% from the record high of $3.66 in July. The remittance token is trading above support at $1.35, while its upside appears limited by key supply zones, starting with $1.40, at the time of writing on Tuesday.

The Citrini report: How a debatable AI narrative can shake Wall Street

That AI-related headline alone was enough to rattle investors.US stocks slid sharply on Monday after a widely circulated Citrini Research memo outlined a hypothetical “2028 Global Intelligence Crisis”, warning that rapid AI adoption could push US unemployment into double digits as early as by mid-2028.

XRP pressured by weak ETF flows and declining retail interest

Ripple (XRP) is edging lower, trading above its intraday low of $1.32 at the time of writing on Tuesday. The decline from its weekly opening of $1.39 reflects heightened volatility in the broader cryptocurrency market, accentuated by tariff-triggered uncertainty.