|

US Dollar Index technical analysis: DXY ending Wednesday at one-month lows near the 98.00 handle

  • DXY is under bearish pressure as the market is challenging the September lows. 
  • DXY is approaching the 100-day simple moving average today at 97.84. 
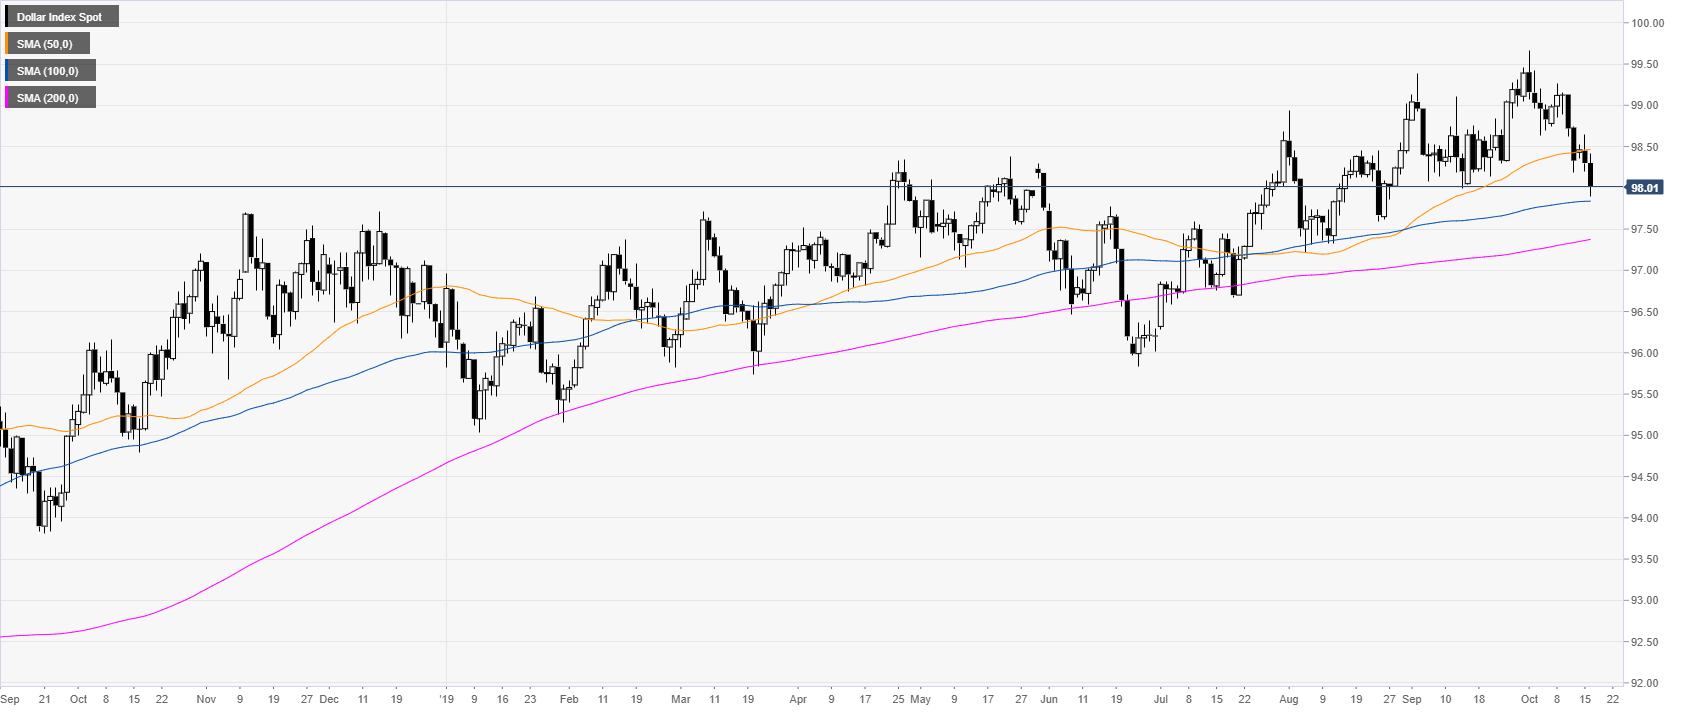
 

DXY daily chart

 
The US Dollar Index (DXY) is trading in a bull trend above the 100 and 200-day simple moving averages (DSMAs). This Wednesday the Greenback declined to the 98.00 handle, trading just above the 100 SMA. On the macroeconomic front, the Retail Sales Control Group in the United States disappointed coming out at 0% vs 0.3% in September, exacerbating the already negative sentiment on the US Dollar. 
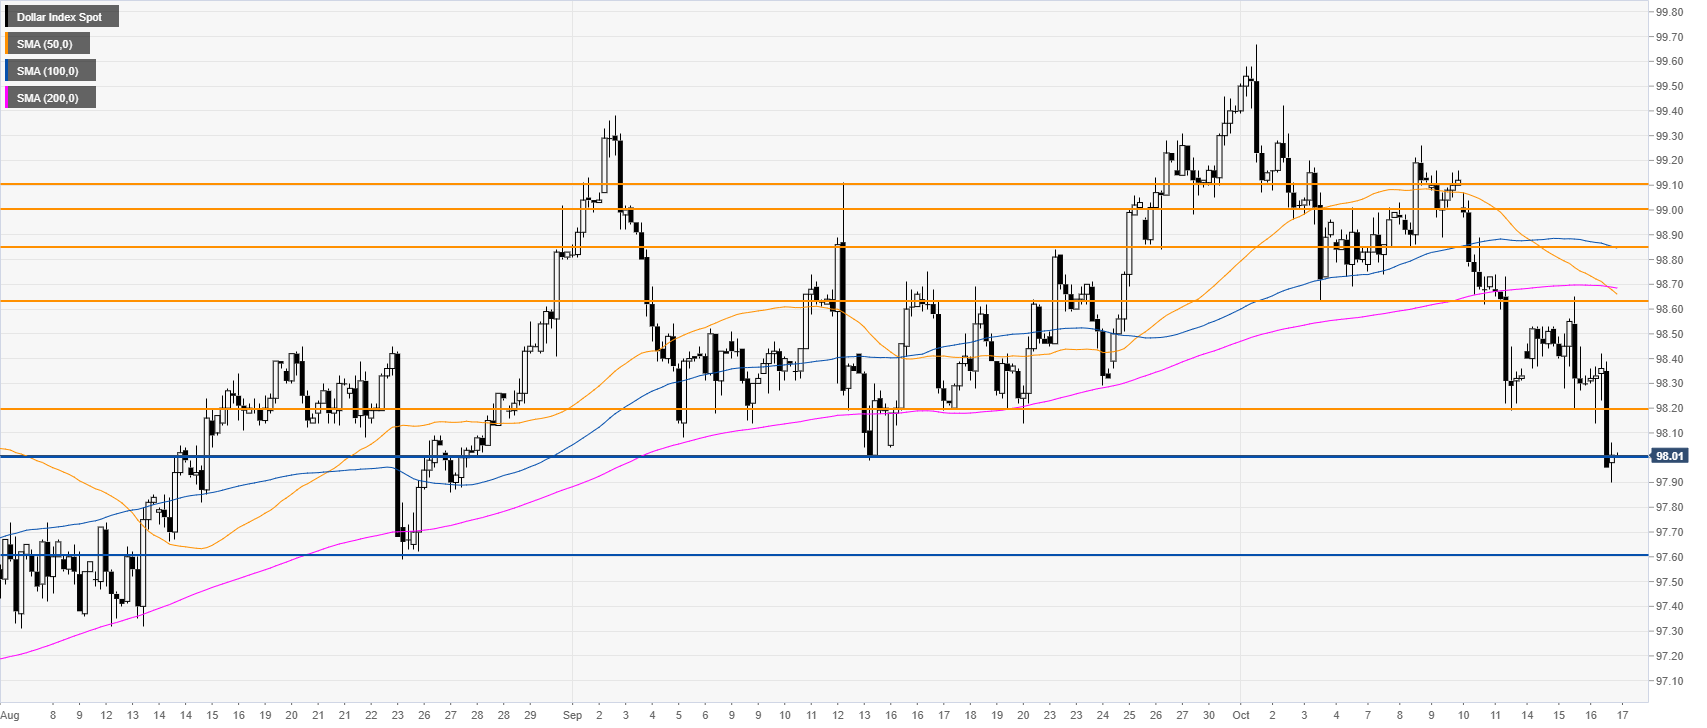
DXY four-hour chart

 
DXY is under bearish pressure below the main SMAs. The market had another leg down to the 98.00 handle and the September lows. If the bears keep the pressure on the market might reach the 97.60 swing low. 
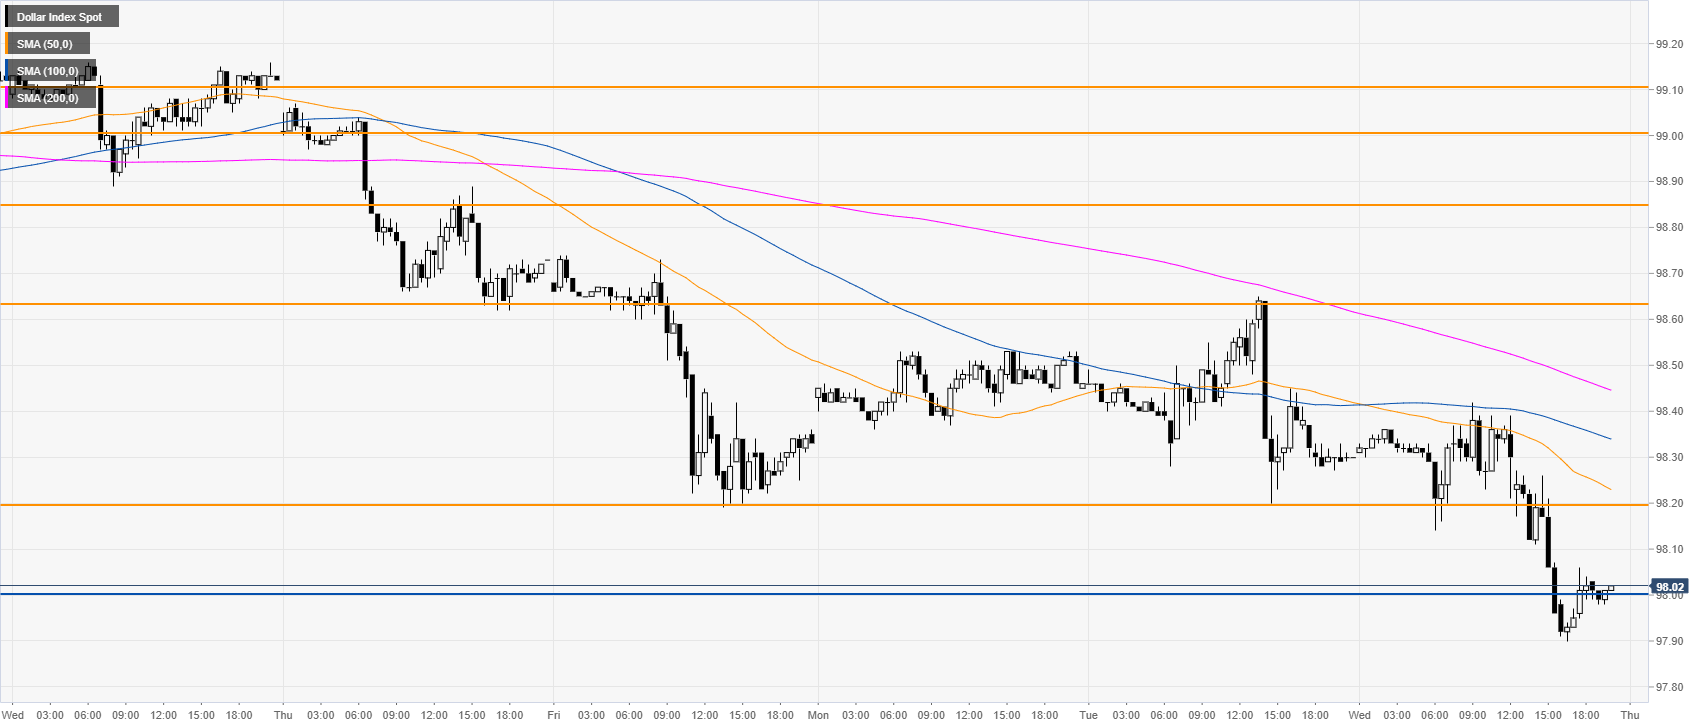
 

DXY 30-minute chart


DXY is trading below the main SMAs, suggesting a bearish bias in the short term. Resistances are seen at the 98.20 and 98.63 levels. Bulls would need to have a daily close above the 98.63 resistance to alleviate the current bearish pressure.
 

Additional key levels 

Dollar Index Spot

Overview
Today last price98.01
Today Daily Change-0.29
Today Daily Change %-0.30
Today daily open98.3
 
Trends
Daily SMA2098.81
Daily SMA5098.46
Daily SMA10097.84
Daily SMA20097.36
 
Levels
Previous Daily High98.65
Previous Daily Low98.2
Previous Weekly High99.26
Previous Weekly Low98.19
Previous Monthly High99.46
Previous Monthly Low97.99
Daily Fibonacci 38.2%98.37
Daily Fibonacci 61.8%98.48
Daily Pivot Point S198.12
Daily Pivot Point S297.93
Daily Pivot Point S397.67
Daily Pivot Point R198.57
Daily Pivot Point R298.83
Daily Pivot Point R399.02

Author

Flavio Tosti

Flavio Tosti

Independent Analyst


More from Flavio Tosti
Share:

Editor's Picks

EUR/USD gathers traction, approaches 1.1800

EUR/USD manages to reverse Tuesday’s pullback, advancing to two-day highs near the 1.1800 hurdle in the latter part of Wednesday’s session. The pair’s decent uptick comes on the back of the modest retracement in the US Dollar, as investors continue to closely follow developments on the trade front and news from the White House in the wake of President Trump’s SOTU speech.

GBP/USD challenges multi-day highs near 1.3530

GBP/USD leaves behind the previous day’s decline and regains fresh upside traction on Wednesday, surpassing the 1.3500 barrier in a context of a modest decline in the Greenback and a generalised improved mood in the risk-linked space. Meanwhile, the US tariff narrative continues to dictate the mood among market participants after Presidet Trump’s SOTU speech failed to surprise markets.

Gold remains bid and close to $5,200

Gold buyers are returning to the fold on Wednesday, targeting the $5,200 area and possibly beyond, after Tuesday’s corrective dip from monthly highs. The rebound in the precious metal comes as the US Dollar loses traction, with Trump’s SOTU speech offering little fresh direction and AI-related nerves continuing to ease.

Crypto Today: Bitcoin, Ethereum, XRP test rebound strength as ETF inflows return

Bitcoin, Ethereum and Ripple are gaining traction at the time of writing on Wednesday, amid persistent market doldrums. The Crypto King is up over 2% intraday, trading above $65,000 from the day’s opening of $64,058.

Nvidia earnings to influence AI trade and broader market sentiment

For the last three years, Nvidia has been the engine of the AI boom, and now Wall Street is watching to see whether that momentum can keep going. High-growth stocks have been struggling to maintain their bullish trend in 2026.

Cosmos Hub Price Forecast: ATOM rebounds slightly, bearish outlook remains intact

Cosmos Hub (ATOM) price rebounds, trading above $2.05 at the time of writing on Wednesday, after undergoing a sharp correction since last week. Weakening on-chain and derivatives data support a bearish outlook, while technical analysis remains unfavorable.