|
US Dollar Index technical analysis: Can the Greenback come back?
- DXY (US Dollar Index) is holding above the key 98.00 handle.
- The United States Retail Sales Group data halts the intraday DXY bleeding.

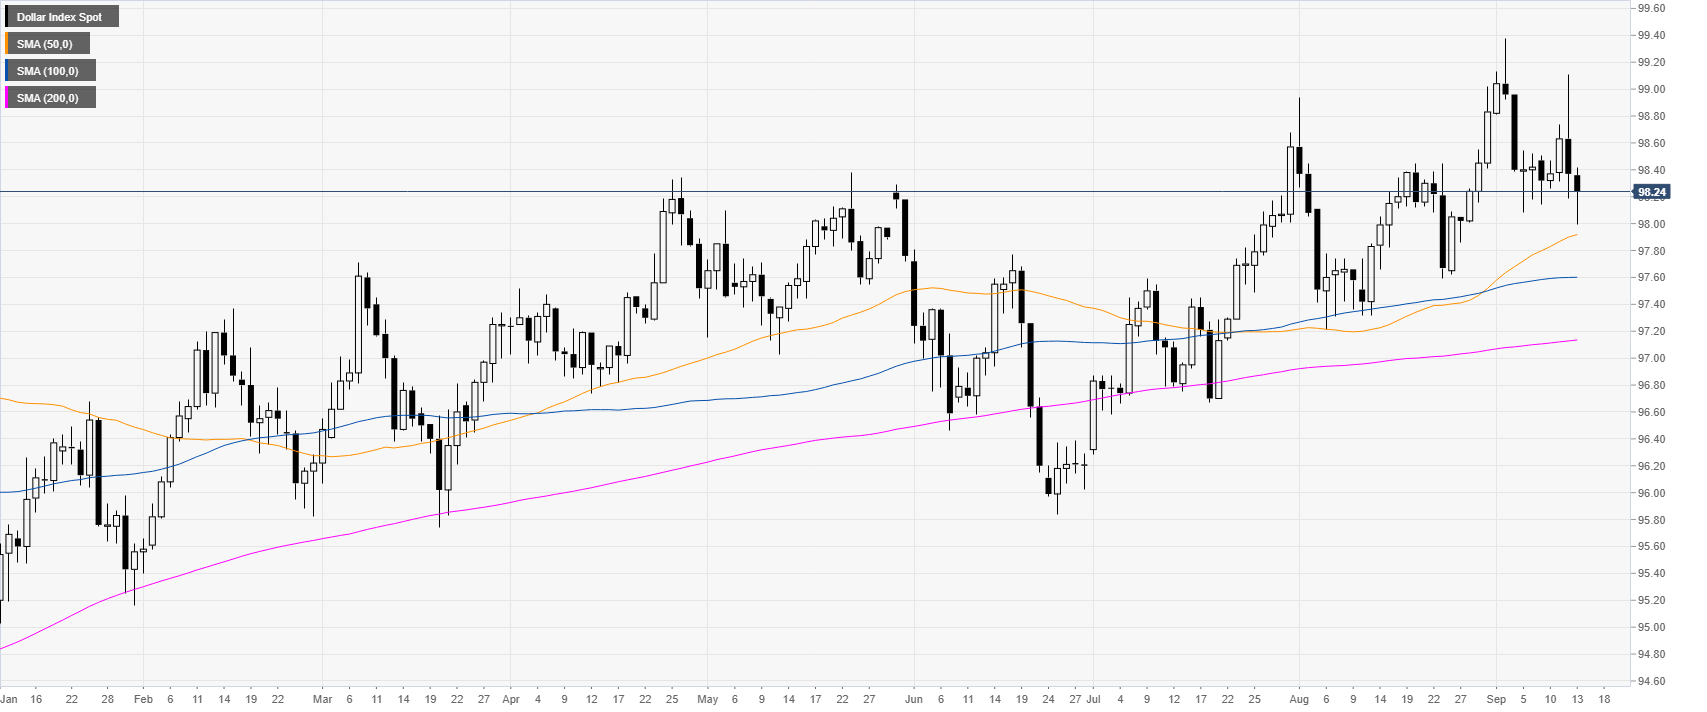
DXY daily chart
DXY (US Dollar Index) is trading in a bull trend above its main daily simple moving averages (DSMAs). The Greenback remains under pressure this Friday although the US Retail Sales Group in August came in line with expectation and put an end to DXY intraday decline.
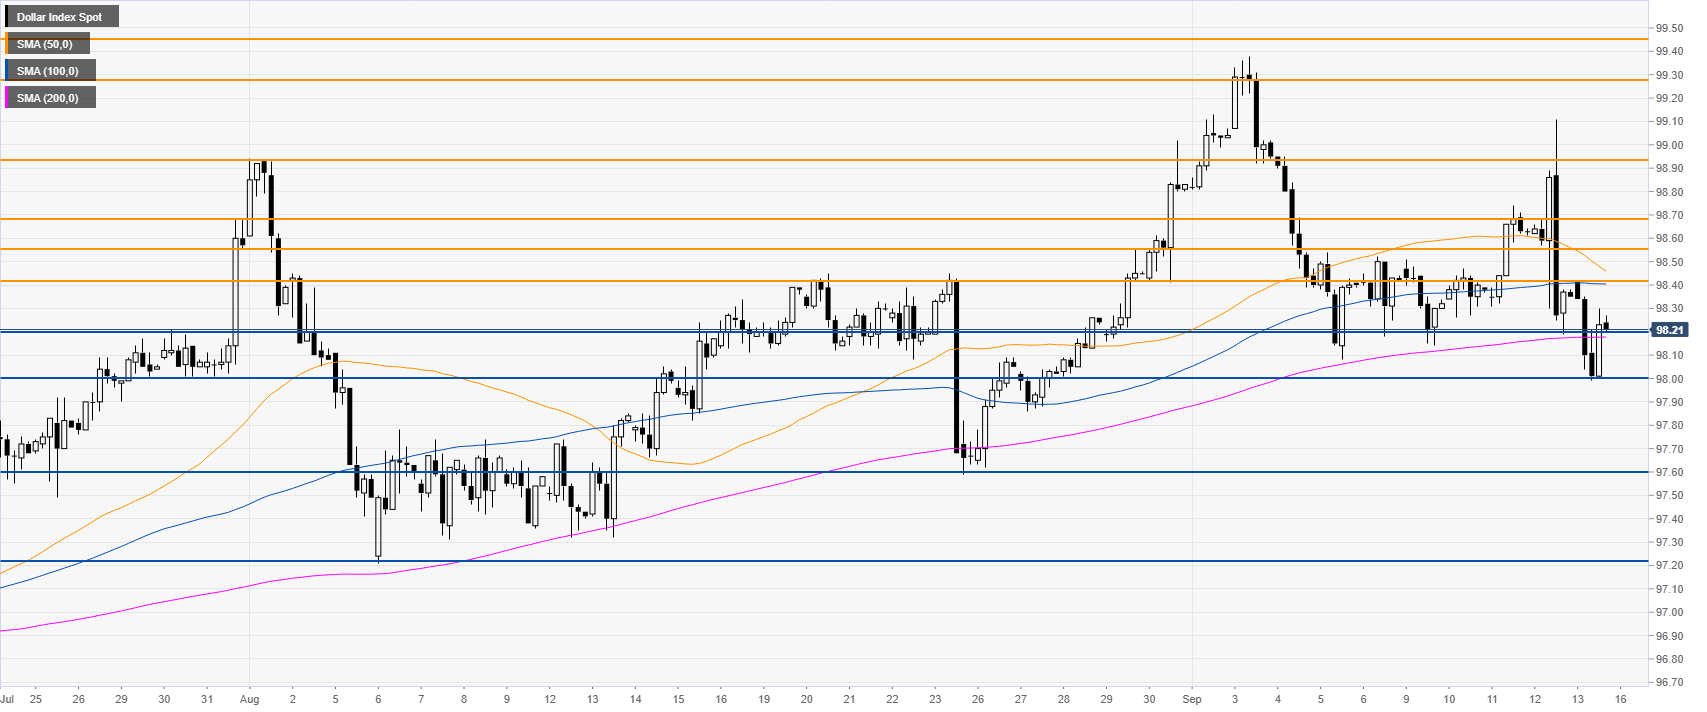
DXY four-hour chart
DXY is holding on above its 200 SMA and a key support at 98.00, suggesting that the bull trend is still into play. However, bulls have a lot of work to do as they have to regain several levels of resistances at 98.42, 98.55 and 98.68.
On the other hand, if DXY loses the 98.00 handle on a daily closing basis, the market might selloff towards 97.60 and 97.20 swing lows. Next week will likely be crucial.
Additional key levels
Author

Flavio Tosti
Independent Analyst
More from Flavio Tosti


