US Dollar Index Price Analysis: Further downside could see 99.10 re-tested


  • DXY gathers further downside traction below the 100.00 mark.
  • Further south aligns recent lows in the 99.15/10 band.

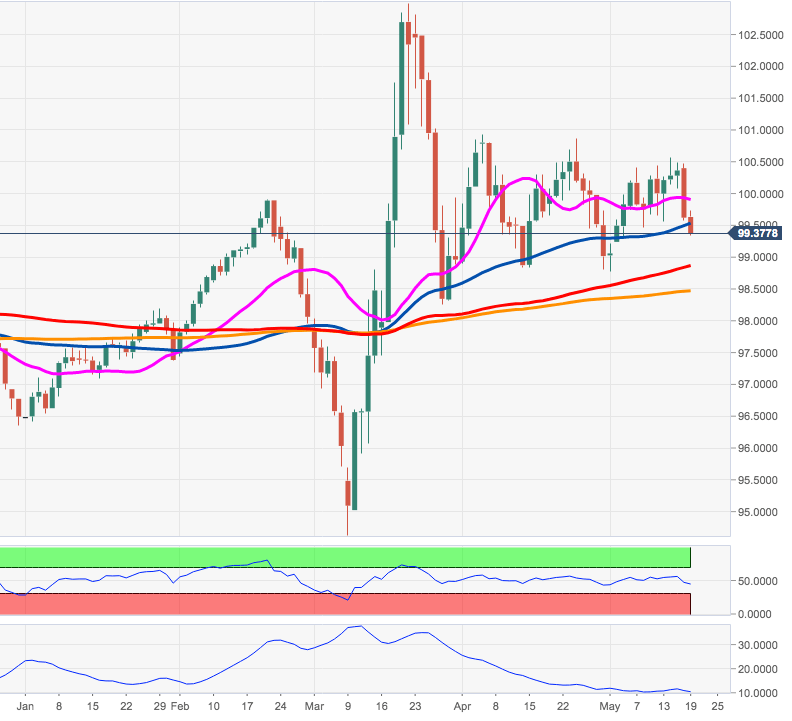
DXY is down for the second session in a row, coming under further selling pressure amidst a strong recovery of the riskier assets. The leg lower has intensified after the breakdown of the 100.00 mark on Monday.

If the selling bias accelerates, the the area of recent lows in the 99/15/10 band should come into focus in the short-term.

A deeper pullback could also contemplate the test of May’s low at 98.57 ahead of the key 200-day SMA, today at 98.45.

DXY daily chart

Dollar Index Spot

Overview
Today last price 99.37
Today Daily Change 39
Today Daily Change % -0.25
Today daily open 99.62
 
Trends
Daily SMA20 99.93
Daily SMA50 99.8
Daily SMA100 98.84
Daily SMA200 98.47
 
Levels
Previous Daily High 100.47
Previous Daily Low 99.58
Previous Weekly High 100.56
Previous Weekly Low 99.56
Previous Monthly High 100.93
Previous Monthly Low 98.81
Daily Fibonacci 38.2% 99.92
Daily Fibonacci 61.8% 100.13
Daily Pivot Point S1 99.31
Daily Pivot Point S2 99
Daily Pivot Point S3 98.42
Daily Pivot Point R1 100.2
Daily Pivot Point R2 100.78
Daily Pivot Point R3 101.09


Share: Feed news

Information on these pages contains forward-looking statements that involve risks and uncertainties. Markets and instruments profiled on this page are for informational purposes only and should not in any way come across as a recommendation to buy or sell in these assets. You should do your own thorough research before making any investment decisions. FXStreet does not in any way guarantee that this information is free from mistakes, errors, or material misstatements. It also does not guarantee that this information is of a timely nature. Investing in Open Markets involves a great deal of risk, including the loss of all or a portion of your investment, as well as emotional distress. All risks, losses and costs associated with investing, including total loss of principal, are your responsibility. The views and opinions expressed in this article are those of the authors and do not necessarily reflect the official policy or position of FXStreet nor its advertisers. The author will not be held responsible for information that is found at the end of links posted on this page.

If not otherwise explicitly mentioned in the body of the article, at the time of writing, the author has no position in any stock mentioned in this article and no business relationship with any company mentioned. The author has not received compensation for writing this article, other than from FXStreet.

FXStreet and the author do not provide personalized recommendations. The author makes no representations as to the accuracy, completeness, or suitability of this information. FXStreet and the author will not be liable for any errors, omissions or any losses, injuries or damages arising from this information and its display or use. Errors and omissions excepted.

The author and FXStreet are not registered investment advisors and nothing in this article is intended to be investment advice.

Recommended content


Recommended content

Editors’ Picks

AUD/USD hovers around 0.6500 amid light trading, ahead of US GDP

AUD/USD hovers around 0.6500 amid light trading, ahead of US GDP

AUD/USD is trading close to 0.6500 in Asian trading on Thursday, lacking a clear directional impetus amid an Anzac Day holiday in Australia. Meanwhile, traders stay cautious due ti risk-aversion and ahead of the key US Q1 GDP release. 

AUD/USD News

USD/JPY finds its highest bids since 1990, near 155.50

USD/JPY finds its highest bids since 1990, near 155.50

USD/JPY keeps breaking into its highest chart territory since June of 1990 early Thursday, testing 155.50 for the first time in 34 years as the Japanese Yen remains vulnerable, despite looming Japanese intervention risks. Focus shifts to Thursday's US GDP report and the BoJ decision on Friday. 

USD/JPY News

Gold price treads water near $2,320, awaits US GDP data

Gold price treads water near $2,320, awaits US GDP data

Gold price recovers losses but keeps its range near $2,320 early Thursday. Renewed weakness in the US Dollar and the US Treasury yields allow Gold buyers to breathe a sigh of relief. Gold price stays vulnerable amid Middle East de-escalation, awaiting US Q1 GDP data. 

Gold News

Injective price weakness persists despite over 5.9 million INJ tokens burned

Injective price weakness persists despite over 5.9 million INJ tokens burned

Injective price is trading with a bearish bias, stuck in the lower section of the market range. The bearish outlook abounds despite the network's deflationary efforts to pump the price. Coupled with broader market gloom, INJ token’s doomed days may not be over yet.

Read more

Meta Platforms Earnings: META sinks 10% on lower Q2 revenue guidance Premium

Meta Platforms Earnings: META sinks 10% on lower Q2 revenue guidance

This must be "opposites" week. While Doppelganger Tesla rode horrible misses on Tuesday to a double-digit rally, Meta Platforms produced impressive beats above Wall Street consensus after the close on Wednesday, only to watch the share price collapse by nearly 10%.

Read more

Forex MAJORS

Cryptocurrencies

Signatures