Dow Jones Industrial Average rebounds as AMD-Meta deal lifts sentiment
- Dow Jones rallies around 425 points as Wall Street rebounds from Monday's AI-led software selloff.
- AMD surges on blockbuster multi-year deal with Meta to supply up to 6 gigawatts of AI chips.
- Home Depot beats earnings expectations, raises dividend amid cautious housing market outlook.
- Consumer confidence edges higher to 91.2 in February, topping expectations of 87.0.

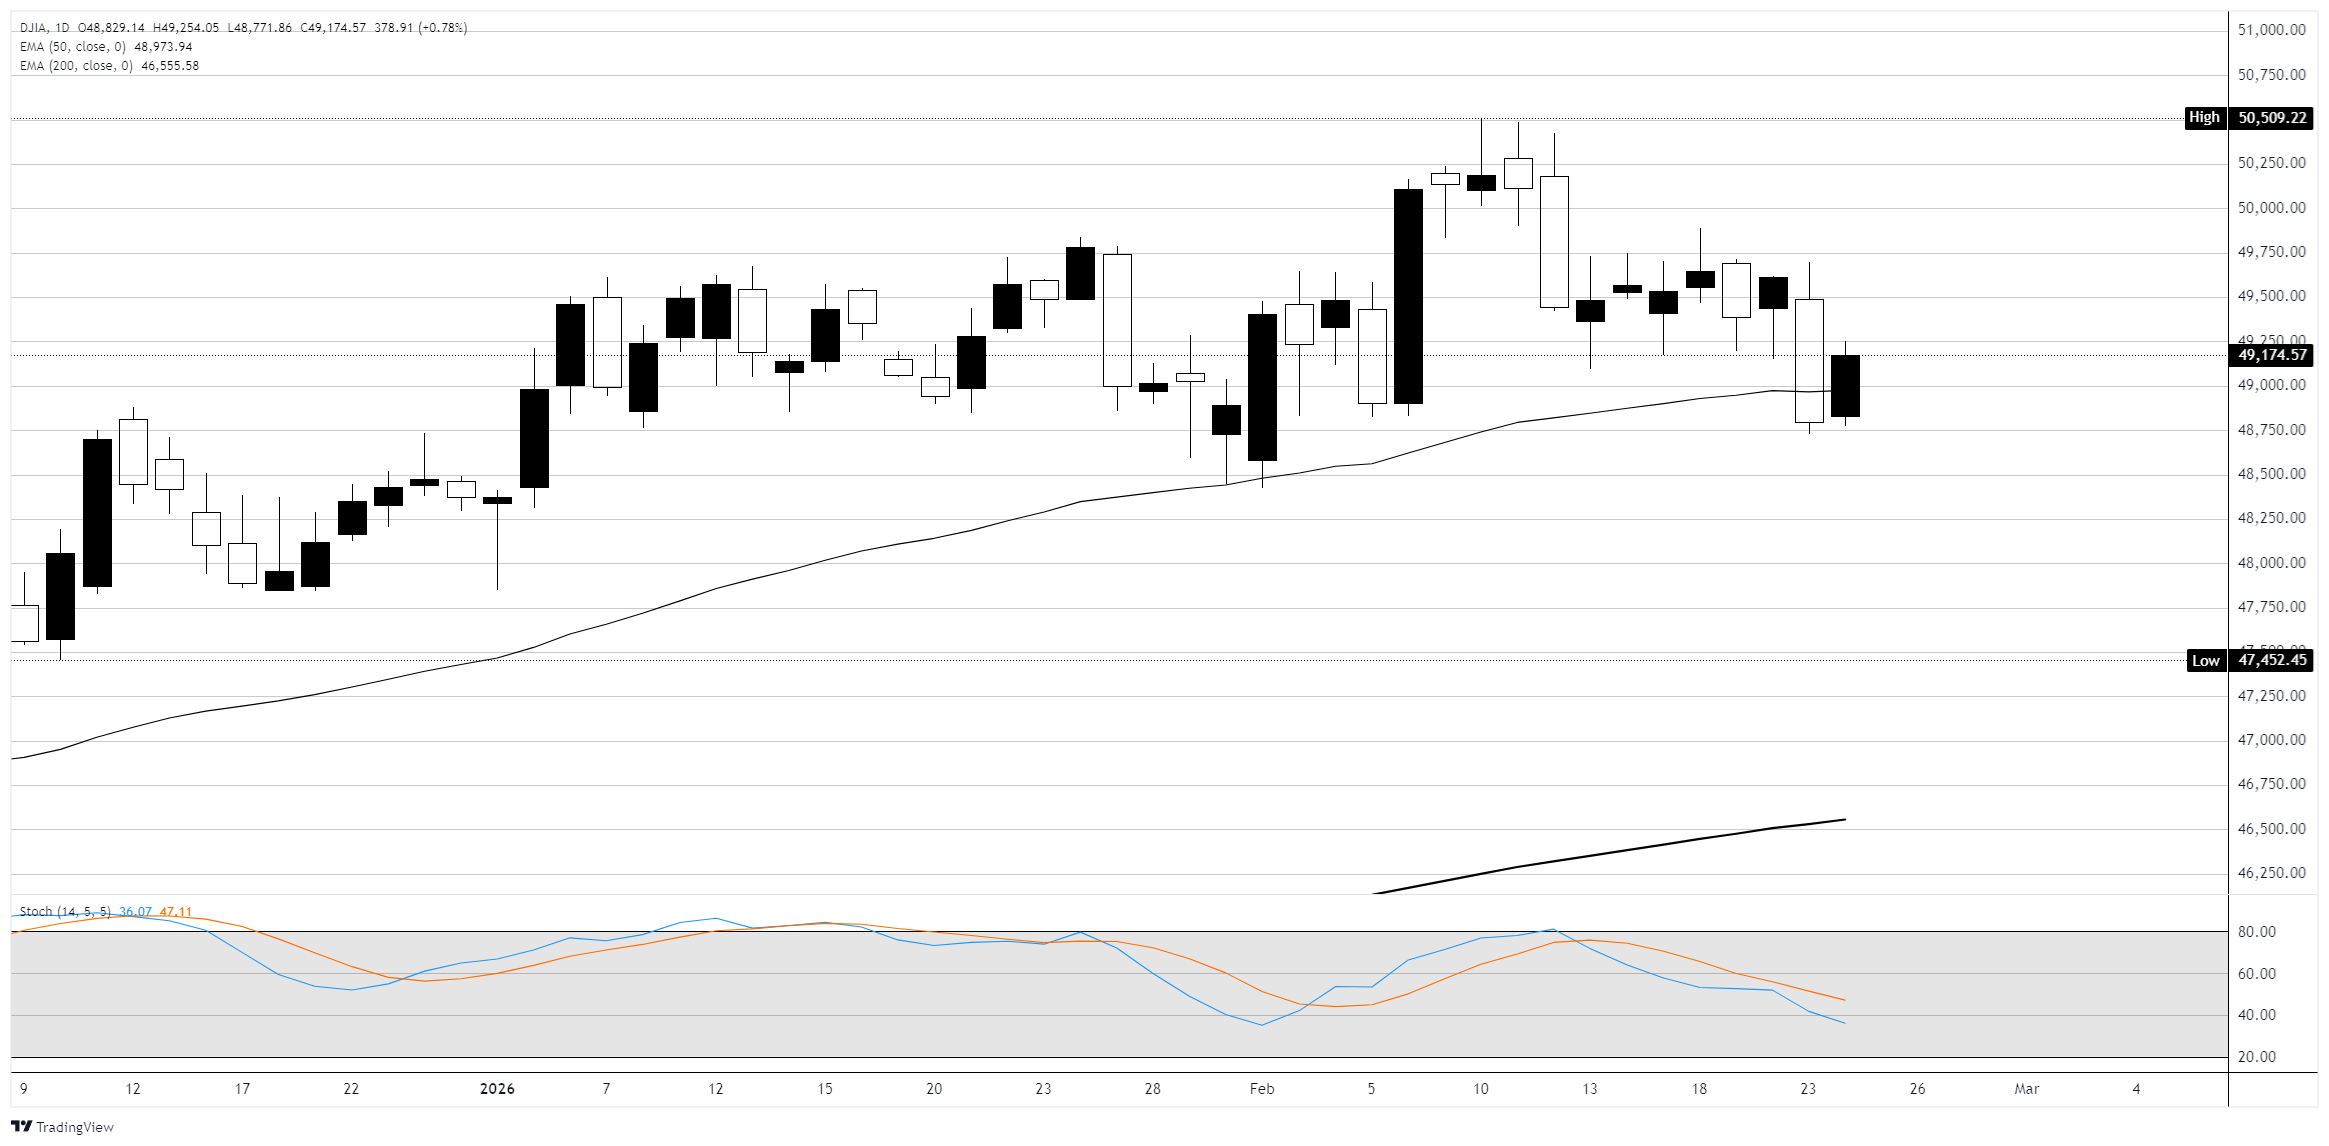
The Dow Jones Industrial Average is up around 425 points, or 0.85%, reclaiming the 49,000 figure in a broad rebound from Monday's steep AI-led software selloff. The S&P 500 is gaining around 0.6% while the Nasdaq Composite is advancing roughly 0.9%, led by strength in semiconductor names. Monday's session saw the Dow shed 822 points as fears over AI disruption to software and consulting businesses combined with fresh tariff uncertainty following US President Trump's move to raise global tariffs to 15% under Section 122 of the Trade Act. Tuesday's bounce is being driven by a landmark chip deal between AMD and Meta, an earnings beat from Home Depot, and better-than-expected consumer confidence data.
AMD surges on blockbuster Meta AI chip deal
Advanced Micro Devices (AMD) is surging around 8% after announcing a multi-year agreement with Meta Platforms Inc. (META) to deploy up to 6 gigawatts of AMD Instinct GPUs across Meta's AI data center infrastructure. The deal, worth tens of billions of dollars per gigawatt according to AMD CEO Lisa Su, includes shipments of custom MI450-based GPUs beginning in the second half of 2026. As part of the agreement, AMD has issued Meta a performance-based warrant for up to 160 million shares of AMD common stock, structured to vest as shipment milestones are achieved. The deal mirrors a similar arrangement AMD struck with OpenAI last October and arrives just days after Meta committed to using millions of Nvidia Corporation (NVDA) chips in a separate partnership, underscoring Meta's portfolio approach to AI infrastructure. Nvidia shares are largely flat ahead of Wednesday's highly anticipated quarterly earnings report.
Home Depot beats estimates amid frozen housing backdrop
Home Depot (HD) is climbing around 3% after posting fourth-quarter results that topped Wall Street expectations. Adjusted earnings per share (EPS) came in at $2.72, well above the consensus estimate of $2.55, while revenue of $38.2 billion edged past the $38.09 billion forecast. Comparable sales rose 0.4%, beating expectations for a 0.4% decline. CEO Ted Decker noted that results were largely in line with internal expectations, citing a lack of storm activity and ongoing consumer uncertainty around housing. CFO Richard McPhail described a "frozen housing environment" that has now persisted for three years. Home Depot's fiscal 2026 guidance calls for total sales growth of 2.5% to 4.5% and comparable sales ranging from flat to up 2%, with adjusted EPS roughly flat to up 4%. The company also raised its quarterly dividend to $2.33 per share.
Software stocks stabilize after Monday's AI-driven rout
Beaten-down software and consulting names are finding some footing on Tuesday after Monday's brutal selloff. International Business Machines (IBM), which plunged 13% on Monday for its worst day since 2000 after Anthropic unveiled new COBOL modernization capabilities in its Claude Code tool, is rebounding modestly. Software names including ServiceNow Inc. (NOW), Salesforce Inc. (CRM), and Intuit Inc. (INTU) are each recovering around 3% on average after getting hammered in the prior session on AI displacement fears. Payment companies including Visa Inc. (V) and Mastercard Inc. (MA) are also stabilizing after fresh concerns that AI disruption could extend to traditional financial infrastructure. The broader question of how quickly AI tools can displace enterprise software spending remains front and center heading into Nvidia and Salesforce earnings on Wednesday.
Consumer confidence tops expectations in February
The Conference Board's Consumer Confidence Index rose 2.2 points to 91.2 in February, beating the consensus forecast of 87.0. January's reading was also revised higher to 89.0 from the initially reported 84.5. The Expectations Index improved slightly as consumers' pessimistic outlook eased somewhat, though the Present Situation Index continued to decline. Chief economist Dana Peterson noted that perceptions of employment conditions improved slightly, with the labor market differential edging up. However, mentions of prices, inflation, and tariffs remained at the top of consumers' minds. The data comes ahead of President Trump's State of the Union address scheduled for Tuesday evening, where further details on trade policy are expected.
Dow Jones daily chart
Dow Jones FAQs
The Dow Jones Industrial Average, one of the oldest stock market indices in the world, is compiled of the 30 most traded stocks in the US. The index is price-weighted rather than weighted by capitalization. It is calculated by summing the prices of the constituent stocks and dividing them by a factor, currently 0.152. The index was founded by Charles Dow, who also founded the Wall Street Journal. In later years it has been criticized for not being broadly representative enough because it only tracks 30 conglomerates, unlike broader indices such as the S&P 500.
Many different factors drive the Dow Jones Industrial Average (DJIA). The aggregate performance of the component companies revealed in quarterly company earnings reports is the main one. US and global macroeconomic data also contributes as it impacts on investor sentiment. The level of interest rates, set by the Federal Reserve (Fed), also influences the DJIA as it affects the cost of credit, on which many corporations are heavily reliant. Therefore, inflation can be a major driver as well as other metrics which impact the Fed decisions.
Dow Theory is a method for identifying the primary trend of the stock market developed by Charles Dow. A key step is to compare the direction of the Dow Jones Industrial Average (DJIA) and the Dow Jones Transportation Average (DJTA) and only follow trends where both are moving in the same direction. Volume is a confirmatory criteria. The theory uses elements of peak and trough analysis. Dow’s theory posits three trend phases: accumulation, when smart money starts buying or selling; public participation, when the wider public joins in; and distribution, when the smart money exits.
There are a number of ways to trade the DJIA. One is to use ETFs which allow investors to trade the DJIA as a single security, rather than having to buy shares in all 30 constituent companies. A leading example is the SPDR Dow Jones Industrial Average ETF (DIA). DJIA futures contracts enable traders to speculate on the future value of the index and Options provide the right, but not the obligation, to buy or sell the index at a predetermined price in the future. Mutual funds enable investors to buy a share of a diversified portfolio of DJIA stocks thus providing exposure to the overall index.
Author

Joshua Gibson
FXStreet
Joshua joins the FXStreet team as an Economics and Finance double major from Vancouver Island University with twelve years' experience as an independent trader focusing on technical analysis.

















