|

US Dollar Index Price Analysis: Further decline stays in the pipeline

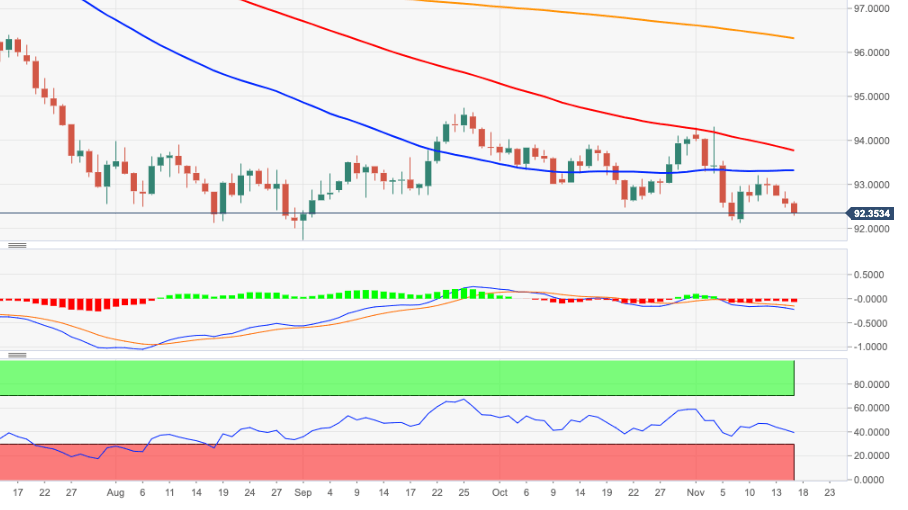
  • DXY remains under pressure and now targets the 92.00 area.
  • A break below this level should pave the way for a move to 2020 low.

The downside momentum in DXY accelerates on Tuesday and challenges the key 6-month support line in the 92.45/40 band.

Further south emerges the monthly lows in the 92.15/10 zone (November 9) ahead of the 2020 low at 91.74 (September 1).

Further out, as long as DXY trades below the 200-day SMA, today at 96.31, the negative view is forecast to persist.

DXY daily chart

Dollar Index Spot

Overview
Today last price92.33
Today Daily Change31
Today Daily Change %-0.25
Today daily open92.56
 
Trends
Daily SMA2093.08
Daily SMA5093.38
Daily SMA10093.82
Daily SMA20096.35
 
Levels
Previous Daily High92.84
Previous Daily Low92.47
Previous Weekly High93.21
Previous Weekly Low92.13
Previous Monthly High94.1
Previous Monthly Low92.47
Daily Fibonacci 38.2%92.61
Daily Fibonacci 61.8%92.7
Daily Pivot Point S192.41
Daily Pivot Point S292.25
Daily Pivot Point S392.03
Daily Pivot Point R192.78
Daily Pivot Point R293
Daily Pivot Point R393.16

Author

Pablo Piovano

Born and bred in Argentina, Pablo has been carrying on with his passion for FX markets and trading since his first college years.

More from Pablo Piovano
Share:

Markets move fast. We move first.

Orange Juice Newsletter brings you expert driven insights - not headlines. Every day on your inbox.

By subscribing you agree to our Terms and conditions.

Editor's Picks

EUR/USD: Bulls pray for a dovish Fed

EUR/USD has finally taken a breather after a pretty energetic climb. The pair broke above 1.1680 in the second half of the week, reaching its highest levels in around two months before running into some selling pressure. Even so, it has gained almost two cents from the late-November dip just below 1.1500 the figure.

GBP/USD trims gains, recedes toward 1.3320

GBP/USD is struggling to keep its daily advance, coming under fresh pressure and retreating to the 1.3320 zone following a mild bullish attempt in the Greenback. Even though US consumer sentiment surprised to the upside, the US Dollar isn’t getting much love, as traders are far more interested in what the Fed will say next week.

Gold: Bullish momentum fades despite broad USD weakness

After rising more than 3.5% in the previous week, Gold has entered a consolidation phase and fluctuated at around $4,200. The Federal Reserve’s interest rate decision and revised Summary of Economic Projections, also known as the dot plot, could trigger the next directional move in XAU/USD. 

Week ahead: Rate cut or market shock? The Fed decides

Fed rate cut widely expected; dot plot and overall meeting rhetoric also matter. Risk appetite is supported by Fed rate cut expectations; cryptos show signs of life. RBA, BoC and SNB also meet; chances of surprises are relatively low. Dollar weakness could linger; both the aussie and the yen best positioned to gain further. Gold and oil eye Ukraine-Russia developments; a peace deal remains elusive.

The Silver disconnection is real

Silver just hit a new all-time high. Neither did gold, nor mining stocks. They all reversed on an intraday basis, but silver’s move to new highs makes it still bullish overall, while the almost complete reversals in gold and miners make the latter technically bearish.

Ripple faces persistent bear risks, shrugging off ETF inflows

Ripple is extending its decline for the second consecutive day, trading at $2.06 at the time of writing on Friday. Sentiment surrounding the cross-border remittance token continues to lag despite steady inflows into XRP spot ETFs.