|

US Dollar Index Price Analysis: Extra losses remain on the table

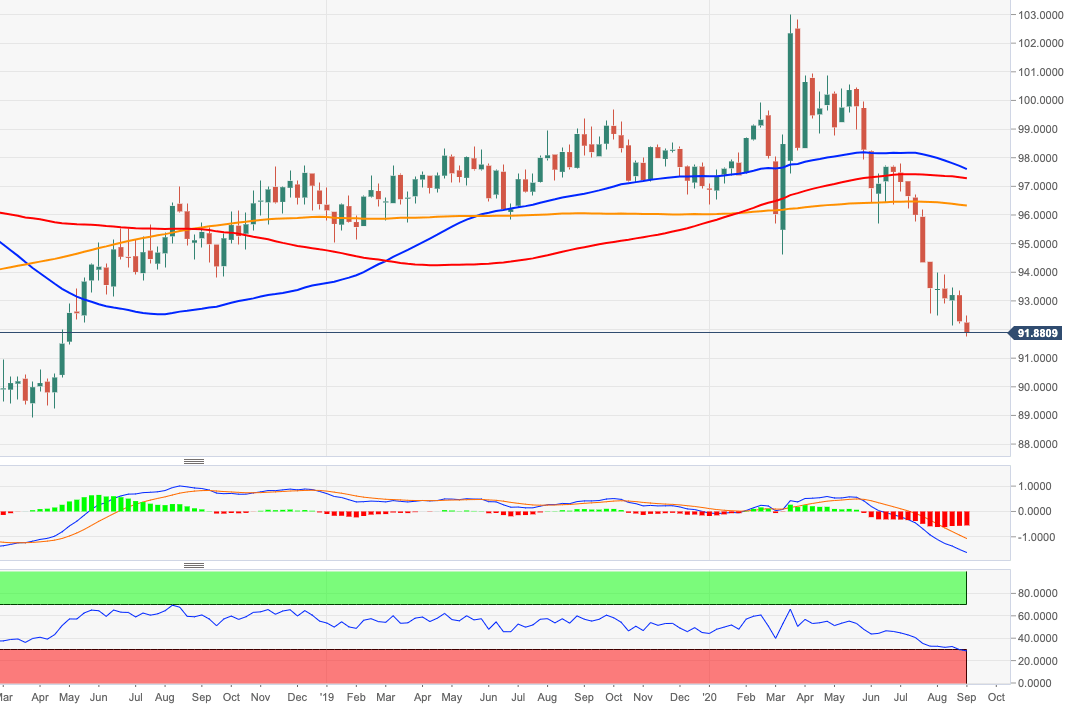
  • DXY is adding to Friday’s sell off below the 92.00 yardstick.
  • While USD-bears remain well in control, a deeper pullback stays on the cards.

DXY dropped to levels last seen in April 2018 in the 91.80/75 band, opening the door for the continuation of the downtrend in the short/medium-term horizon.

That said, further losses are likely under the current bearish context, leaving the index ripe for a move further south of recent lows at 91.75. Against this, the next support of note emerges at the April 2018 low at 89.23 ahead of the March 2018 low at 88.94.

The offered stance in the dollar is expected to remain unchanged while below the 200-day SMA, today at 97.48.

DXY weekly chart

Dollar Index Spot

Overview
Today last price91.86
Today Daily Change44
Today Daily Change %-0.35
Today daily open92.18
 
Trends
Daily SMA2093.01
Daily SMA5094.72
Daily SMA10096.78
Daily SMA20097.52
 
Levels
Previous Daily High92.48
Previous Daily Low92
Previous Weekly High93.36
Previous Weekly Low92.2
Previous Monthly High94
Previous Monthly Low92
Daily Fibonacci 38.2%92.18
Daily Fibonacci 61.8%92.29
Daily Pivot Point S191.96
Daily Pivot Point S291.74
Daily Pivot Point S391.48
Daily Pivot Point R192.43
Daily Pivot Point R292.69
Daily Pivot Point R392.91

Author

Pablo Piovano

Born and bred in Argentina, Pablo has been carrying on with his passion for FX markets and trading since his first college years.

More from Pablo Piovano
Share:

Editor's Picks

EUR/USD loses ground below 1.1850 ahead of FOMC Minutes

The EUR/USD pair loses traction near 1.1840 during the early European session on Wednesday, pressured by renewed US Dollar demand. Traders brace for the Federal Open Market Committee Minutes for signals on future rate cuts, which will be released later on Wednesday. 

When is the UK CPI data and how could it affect GBP/USD?

The United Kingdom Consumer Price Index data for January is scheduled to be published today at 07:00 GMT. GBP/USD trades slightly lower at around 1.3556 as of writing. The 20-period Exponential Moving Average trends lower at 1.3593 and continues to cap rebounds. Price holds beneath this gauge, maintaining a short-term bearish bias.

Gold: Is the $5,000 level back in sight?

Gold snaps a two-day downtrend, as recovery gathers traction toward $5,000 on Wednesday. The US Dollar recovers from the overnight sell-off as rebalancing trades resume ahead of Fed Minutes. The 38.2% Fib support holds on the daily chart for now. What does that mean for Gold?

Pi Network rally defies market pressure ahead of its first anniversary

Pi Network is trading above $0.1900 at press time on Wednesday, extending the weekly gains by nearly 8% so far. The steady recovery is supported by a short-term pause in mainnet migration, which reduces pressure on the PI token supply for Centralized Exchanges. The technical outlook focuses on the $0.1919 resistance as bullish momentum increases.

UK jobs market weakens, bolstering rate cut hopes

In the UK, the latest jobs report made for difficult reading. Nonetheless, this represents yet another reminder for the Bank of England that they need to act swiftly given the collapse in inflation expected over the coming months. 

Ripple slides to $1.45 as downside risks surge

Ripple edges lower at the time of writing on Tuesday, from the daily open of $1.48, as headwinds persist across the crypto market. A short-term support is emerging at $1.45, but a buildup of bearish positions could further weaken the derivatives market and prolong the correction.