|

US Dollar Index Price Analysis: Extra losses look likely near-term

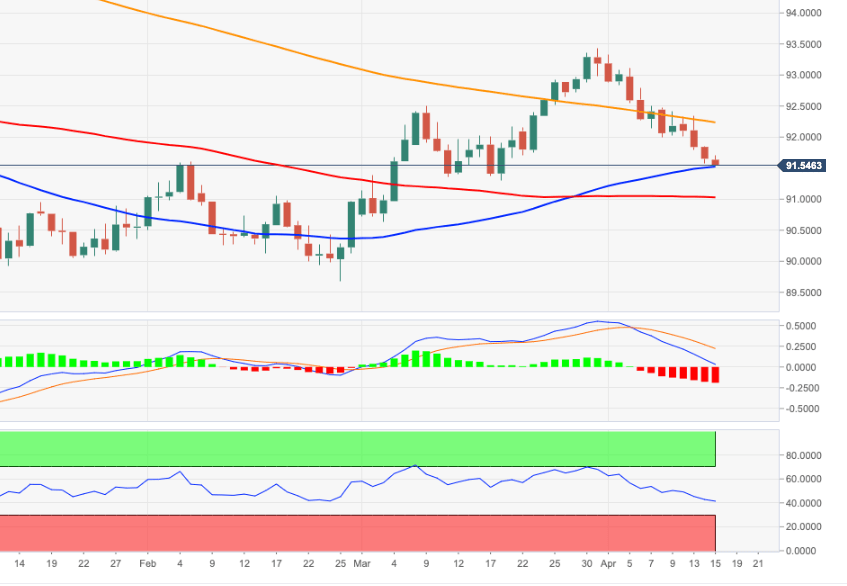
  • DXY’s downside flirts with lows in the mid-91.00s.
  • Next on the downside is located the 91.30 area.

The downtrend in DXY remains unabated, picking up extra pace following the recent break below the critical 200-day SMA in past sessions.

That said, a sustainable breach of the 50-day SMA near 91.60 should pave the way for the continuation of the selling bias with the next target emerging around 91.30, where sit weekly lows recorded in mid-March.

Below the 200-day SMA (92.23) the outlook for DXY is expected to remain on the bearish side.

DXY daily chart
Dollar Index Spot

Overview
Today last price91.56
Today Daily Change17
Today Daily Change %-0.10
Today daily open91.65
 
Trends
Daily SMA2092.43
Daily SMA5091.57
Daily SMA10091.03
Daily SMA20092.26
 
Levels
Previous Daily High91.85
Previous Daily Low91.58
Previous Weekly High93.11
Previous Weekly Low92
Previous Monthly High93.44
Previous Monthly Low90.63
Daily Fibonacci 38.2%91.68
Daily Fibonacci 61.8%91.74
Daily Pivot Point S191.53
Daily Pivot Point S291.42
Daily Pivot Point S391.26
Daily Pivot Point R191.81
Daily Pivot Point R291.97
Daily Pivot Point R392.08

Author

Pablo Piovano

Born and bred in Argentina, Pablo has been carrying on with his passion for FX markets and trading since his first college years.

More from Pablo Piovano

Share:

Editor's Picks

British Pound eases to 1.3450 area following downwardly revised Manufacturing PMI data

The British Pound is trimming previous gains against the US Dollar on Monday, returning to the mid-range of the 1.3400s down from fresh seven-week highs, above 1.3500 earlier on the day. Weaker-than-expected UK manufacturing data added pressure on the Pound, which rallied at the Asian session opening, amid news of a halt to the hostilities in Iran.

EUR/USD consolidates previous week's gains above 1.1500

EUR/USD struggles to build on the previous week's impressive gains but manages to hold comfortably above 1.1500 on Monday. The USD loses traction and helps the pair hold its ground following US President Trump's call off an attack on Iran and that talks between the two sides would happen on Monday. Traders will closely monitor the developments surrounding US-Iran negotiations and US ISM PMI data.

Gold extends range play below $4,100 as focus remains on Middle East

Gold struggles to capitalize on its weekly bullish gap and remains below the $4,100 mark in the second half of the day. The US Dollar stages a modest recovery from its lowest level since June 17, which is seen capping the upside for the commodity. The upside for the USD, however, seems limited amid renewed hopes for a US-Iran peace deal and receding US Fed rate-hike expectations.

Week ahead: US payrolls report and AI earnings to keep investors on edge

After the Fed decision, NFP report awaited for more rate hike clues. Employment also on the agenda in Canada and New Zealand. Chinese trade and Japanese wage data to be watched too. But Iran and AI headlines to remain in driver’s seat for risk sentiment.

Solana risks a steeper decline below $70 despite steady ETF inflows

Solana (SOL) is trading in the red, losing bullish momentum and remaining capped below its 50-day Exponential Moving Average at $75.68. SOL-focused Exchange Traded Funds show resilience with a monthly inflow of $14.62 million in July, while the near-term retail support wanes with the funding rate turning negative.

9-3: Is the Federal Reserve’s vote tally Warsh's new forward guidance?
The rate did not move. Neither did the statement, and that’s the more interesting fact. Set the July 29 Federal Open Market Committee (FOMC) statement beside the one issued on June 17, and the two documents are identical apart from a single verb and a paragraph at the bottom naming three dissenters.













