|

US Dollar Index Price Analysis: DXY records its largest weekly decline since 1986

  • US dollar index (DXY) broke below the 99.00 figure and the 100/200 SMA on the four-hour chart. 
  • The level to beat for bears is the 98.00 support. 
 

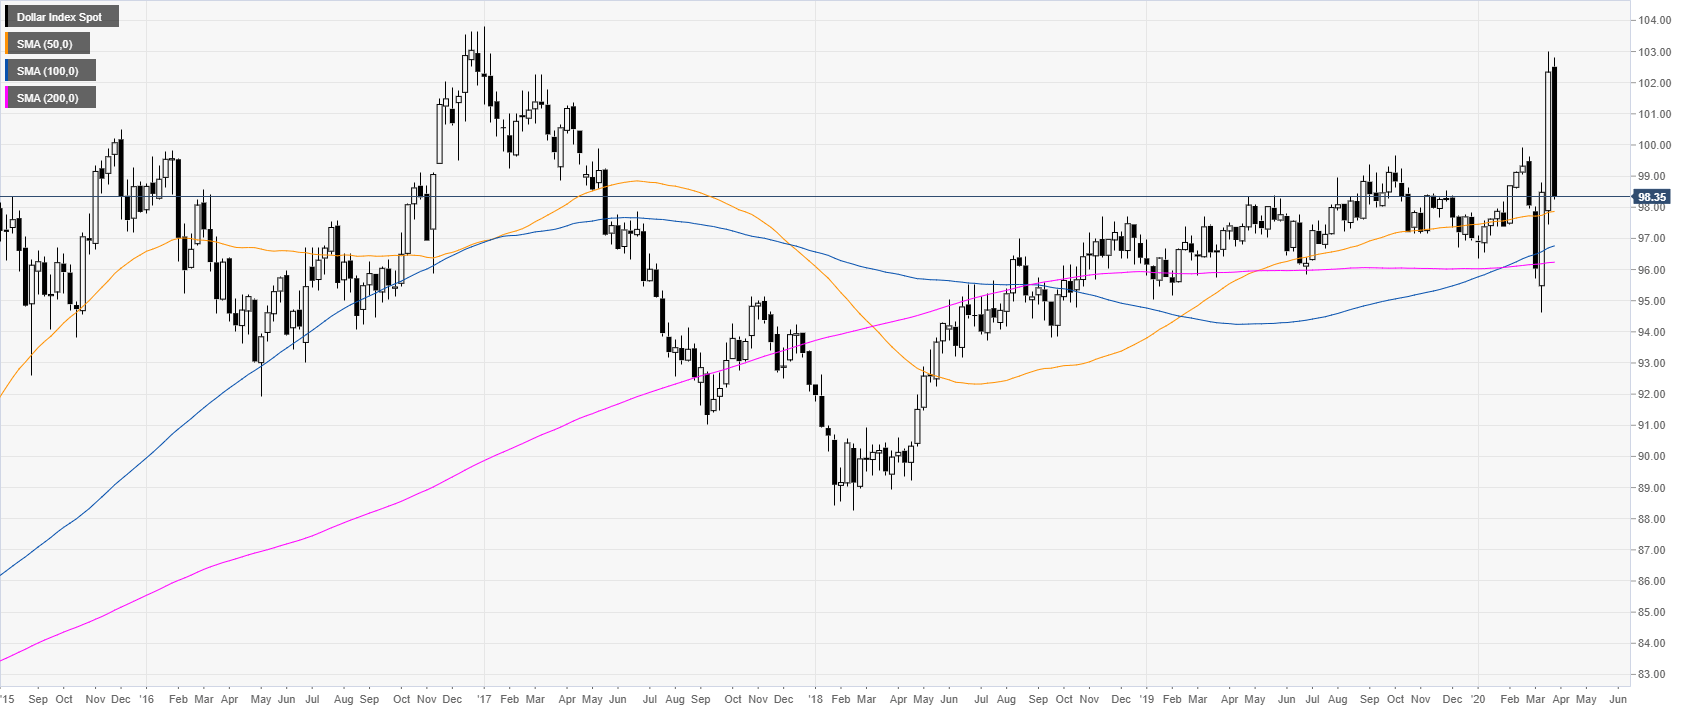
DXY weekly chart chart

 
DXY had its worst weekly decline since April 1986 as the bearish pressure has been relentless throughout the week. 
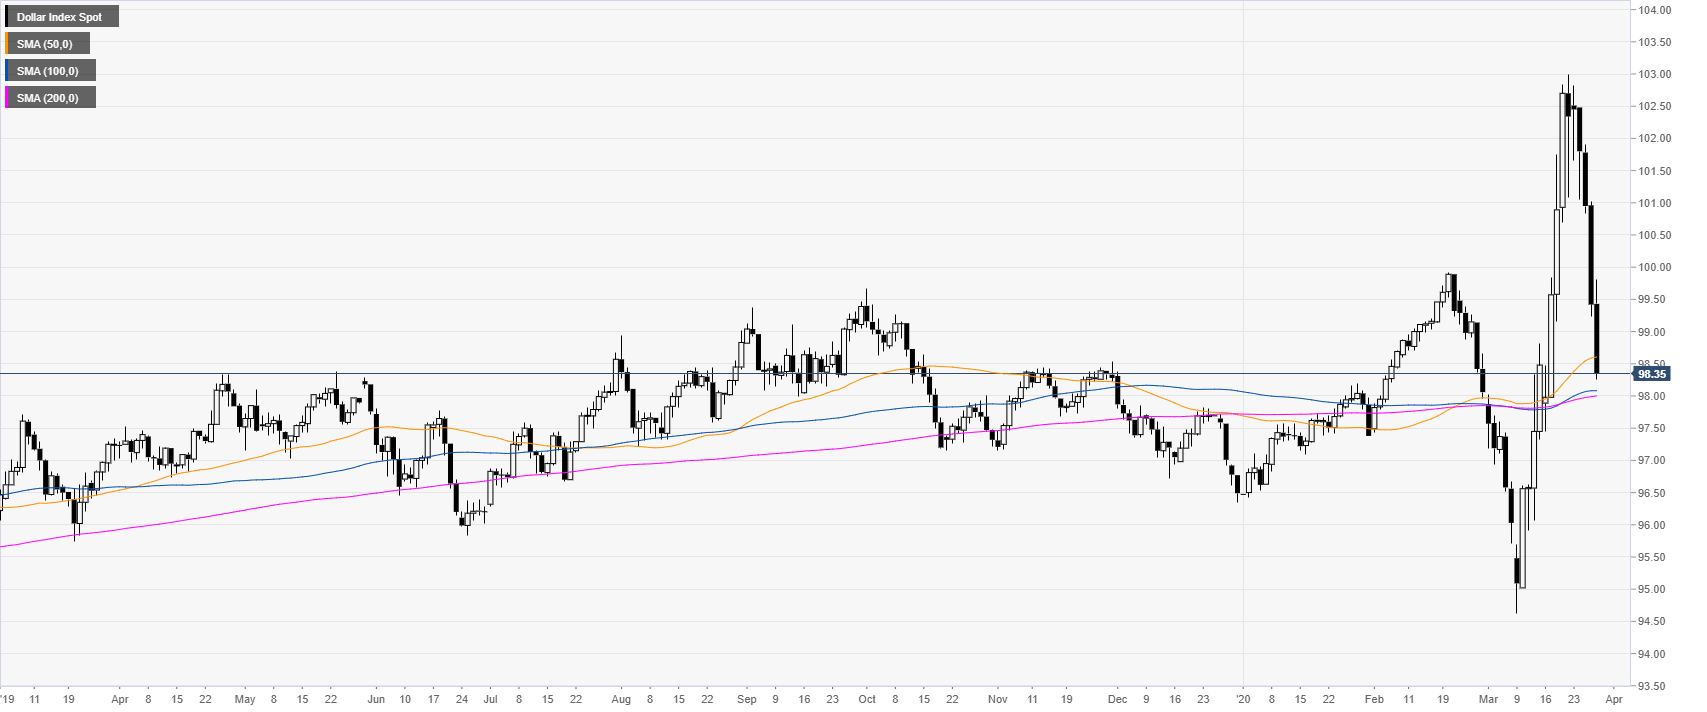
 

DXY daily chart

 
The greenback is nearing its daily 100 and 200 SMAs near the 98.00 figure. It is likely that next week DXY will challenge the above-mentioned level. 
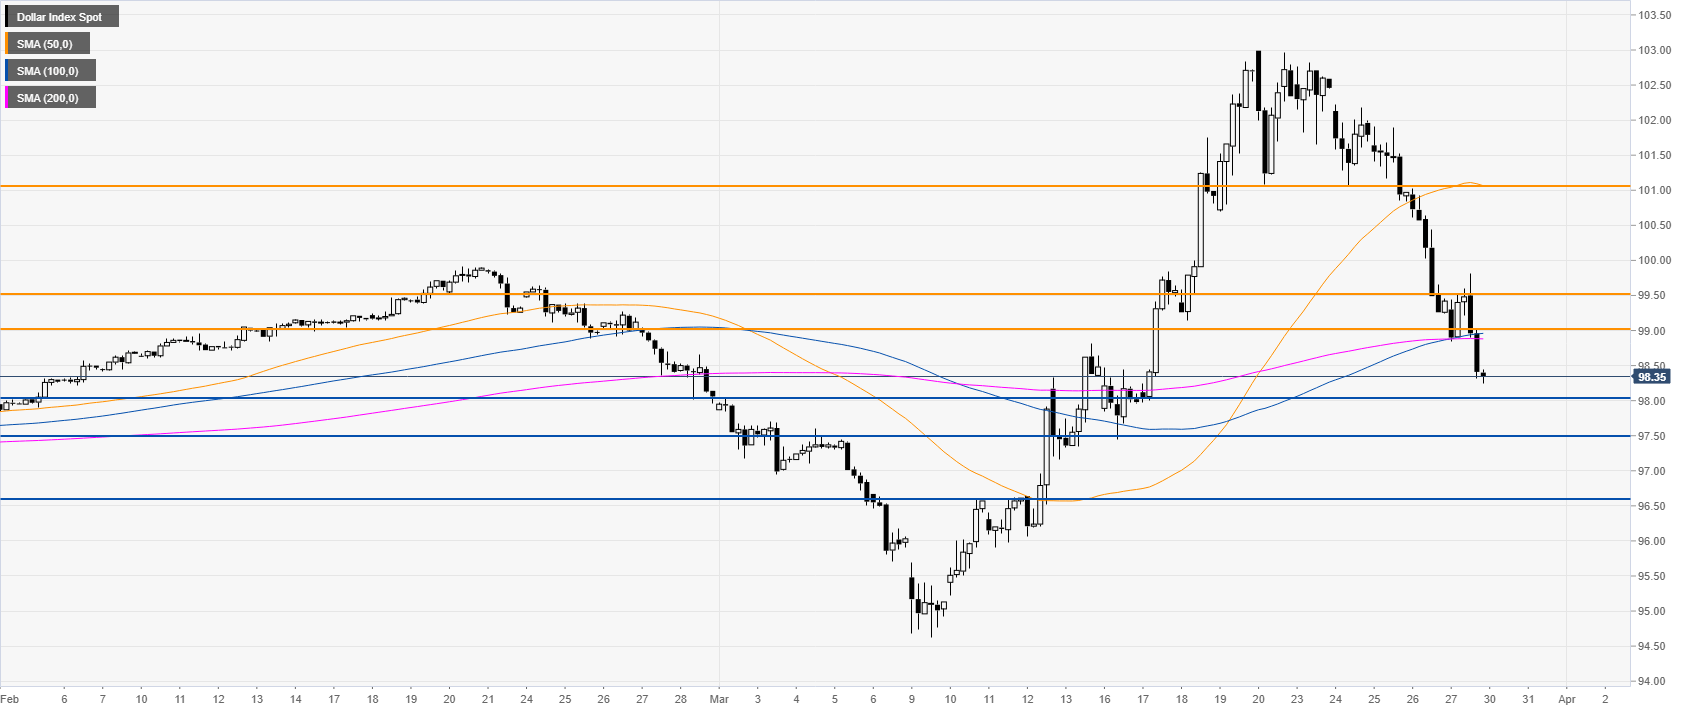
 

DXY four-hour chart

 
After an attempted bounce near the 99.00 figure near the 100/200 SMAs on the four chart, DXY broke below and reached a low of 98.25 this Friday. As the bears are in control, DXY is set to extend losses towards the 98.00, 97.00 and 96.60 levels in the medium term.
 

Additional key levels

Dollar Index Spot

Overview
Today last price98.35
Today Daily Change-1.07
Today Daily Change %-1.08
Today daily open99.42
 
Trends
Daily SMA2098.75
Daily SMA5098.59
Daily SMA10098.08
Daily SMA20097.99
 
Levels
Previous Daily High101.02
Previous Daily Low99.24
Previous Weekly High103
Previous Weekly Low97.45
Previous Monthly High99.91
Previous Monthly Low97.44
Daily Fibonacci 38.2%99.92
Daily Fibonacci 61.8%100.34
Daily Pivot Point S198.77
Daily Pivot Point S298.11
Daily Pivot Point S396.99
Daily Pivot Point R1100.55
Daily Pivot Point R2101.67
Daily Pivot Point R3102.33

Author

Flavio Tosti

Flavio Tosti

Independent Analyst


More from Flavio Tosti
Share:

Editor's Picks

EUR/USD trims gains, back below 1.1800

EUR/USD now loses some upside momentum, returning to the area below the 1.1800 support as the Greenback manages to regain some composure following the SCOTUS-led pullback earlier in the session.

GBP/USD off highs, recedes to the sub-1.3500 area

Following earlier highs north of 1.3500 the figure, GBP/USD now faces some renewed downside pressure, revisiting the 1.3490 zone as the US Dollar manages to regain some upside impulse in the latter part of the NA session on Friday.

Gold climbs to weekly tops, approaches $5,100/oz

Gold keeps the bid tone well in place at the end of the week, now hitting fresh weekly highs and retargeting the key $5,100 mark per troy ounce. The move higher in the yellow metal comes in response to ongoing geopolitical tensions in the Middle East and modest losses in the US Dollar.

Crypto Today: Bitcoin, Ethereum, XRP rebound as risk appetite improves

Bitcoin rises marginally, nearing the immediate resistance of $68,000 at the time of writing on Friday. Major altcoins, including Ethereum and Ripple, hold key support levels as bulls aim to maintain marginal intraday gains.

Week ahead – Markets brace for heightened volatility as event risk dominates

Dollar strength dominates markets as risk appetite remains subdued. A Supreme Court ruling, geopolitics and Fed developments are in focus. Pivotal Nvidia earnings on Wednesday as investors question tech sector weakness.

Ripple bulls defend key support amid waning retail demand and ETF inflows

XRP ticks up above $1.40 support, but waning retail demand suggests caution. XRP attracts $4 million in spot ETF inflows on Thursday, signaling renewed institutional investor interest.