- DXY extends pullback from highest in one month.
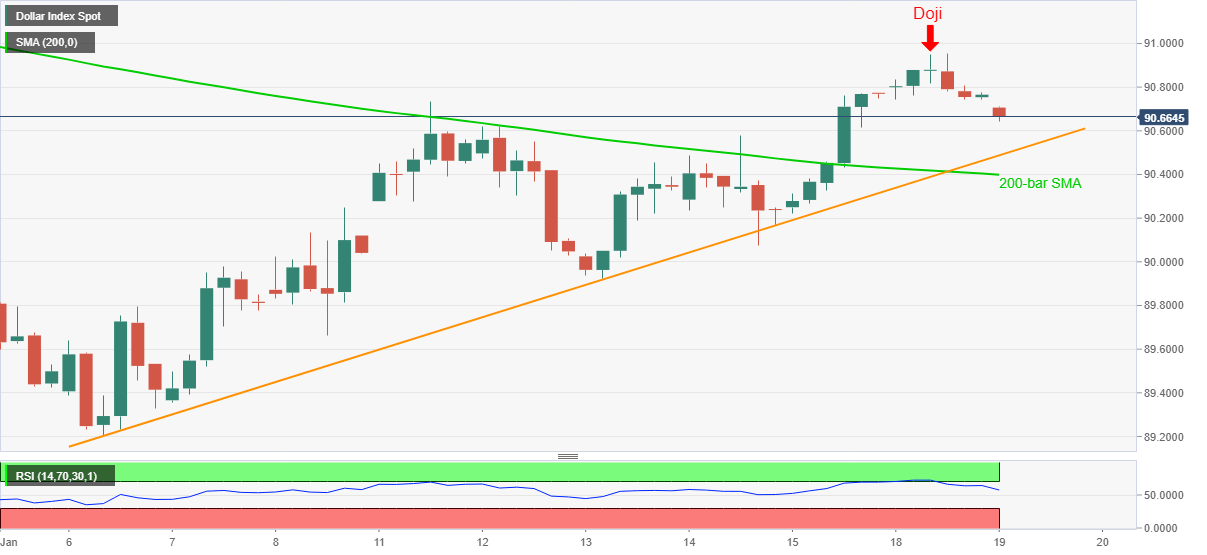
- Monday’s Doji at multi-day top, overbought RSI favor further consolidation of gains.
- 200-bar SMA adds to the downside filters, bulls need a clear break of December 07 top for fresh entries.
US dollar index (DXY) remains on the back foot around 90.68, down 0.10% intraday, during early Tuesday.
The greenback gauge versus major currencies surged to the highest since December 21 the previous day before taking a U-turn from 90.95. In doing so, the index prints Doji candlestick formation suggesting a reversal in the established move at the multi-day high. The signals from the candlestick pattern gained extra strength amid overbought RSI conditions.
As a result, DXY dropped afterward and is currently targeting an upward sloping trend line from January 06, at 90.48.
It should, however, be noted that the gauge’s downside past-90.48 will need to break the 200-bar SMA level of 90.39 and the 90.00 threshold to convince the bears.
Alternatively, a clear run-up beyond the latest high of 90.95 won’t be enough to recall the DXY buyers as the 91.00 threshold and high marked on December 07, around 91.25 become extra hurdles to watch.
Overall, DXY is likely to witness a pullback during the short-term uptrend. However, risk-on mood and expectations of further optimism may challenge the bulls should the quote ignores immediate supports.
Read: S&P 500 Futures gain half a percent towards 3,800 as markets brace for Biden welcome
DXY four-hour chart
Trend: Further weakness expected
Information on these pages contains forward-looking statements that involve risks and uncertainties. Markets and instruments profiled on this page are for informational purposes only and should not in any way come across as a recommendation to buy or sell in these assets. You should do your own thorough research before making any investment decisions. FXStreet does not in any way guarantee that this information is free from mistakes, errors, or material misstatements. It also does not guarantee that this information is of a timely nature. Investing in Open Markets involves a great deal of risk, including the loss of all or a portion of your investment, as well as emotional distress. All risks, losses and costs associated with investing, including total loss of principal, are your responsibility. The views and opinions expressed in this article are those of the authors and do not necessarily reflect the official policy or position of FXStreet nor its advertisers. The author will not be held responsible for information that is found at the end of links posted on this page.
If not otherwise explicitly mentioned in the body of the article, at the time of writing, the author has no position in any stock mentioned in this article and no business relationship with any company mentioned. The author has not received compensation for writing this article, other than from FXStreet.
FXStreet and the author do not provide personalized recommendations. The author makes no representations as to the accuracy, completeness, or suitability of this information. FXStreet and the author will not be liable for any errors, omissions or any losses, injuries or damages arising from this information and its display or use. Errors and omissions excepted.
The author and FXStreet are not registered investment advisors and nothing in this article is intended to be investment advice.
Recommended content
Editors’ Picks
EUR/USD edges lower toward 1.0700 post-US PCE

EUR/USD stays under modest bearish pressure but manages to hold above 1.0700 in the American session on Friday. The US Dollar (USD) gathers strength against its rivals after the stronger-than-forecast PCE inflation data, not allowing the pair to gain traction.
GBP/USD retreats to 1.2500 on renewed USD strength

GBP/USD lost its traction and turned negative on the day near 1.2500. Following the stronger-than-expected PCE inflation readings from the US, the USD stays resilient and makes it difficult for the pair to gather recovery momentum.
Gold struggles to hold above $2,350 following US inflation

Gold turned south and declined toward $2,340, erasing a large portion of its daily gains, as the USD benefited from PCE inflation data. The benchmark 10-year US yield, however, stays in negative territory and helps XAU/USD limit its losses.
Bitcoin Weekly Forecast: BTC’s next breakout could propel it to $80,000 Premium

Bitcoin’s recent price consolidation could be nearing its end as technical indicators and on-chain metrics suggest a potential upward breakout. However, this move would not be straightforward and could punish impatient investors.
Week ahead – Hawkish risk as Fed and NFP on tap, Eurozone data eyed too

Fed meets on Wednesday as US inflation stays elevated. Will Friday’s jobs report bring relief or more angst for the markets? Eurozone flash GDP and CPI numbers in focus for the Euro.