|

US Dollar Index Price Analysis: A test of 101.00 still stays on the cards

  • DXY keeps consolidating the breakout of the 100.00 mark.
  • A surpass of 100.56 should put 101.00 back on the radar.

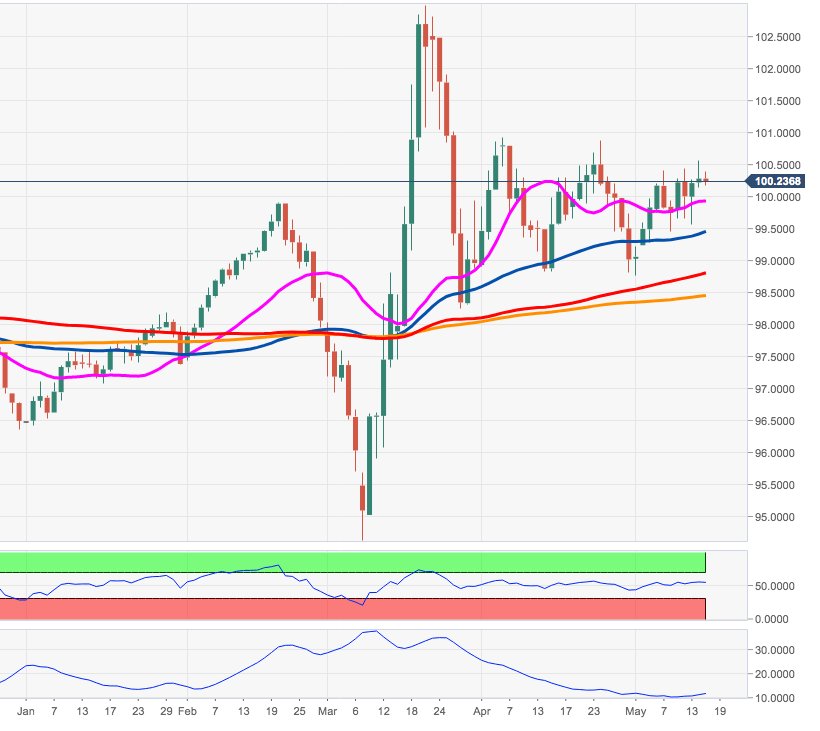
DXY keeps navigating the upper end of the monthly range above the 100.00 mark and approaches the tough barrier in the 100.50 area, where converge May tops and a Fibo retracement (of the 2017-2018 drop).

A clear breakout of this key hurdle is expected to pave the way for another visit to the April peaks in the 101.00 neighbourhood.

On the broader picture, the 200-day SMA – today at 98.43 – continues to underpin the constructive outlook in the dollar for the time being.

DXY daily chart

Dollar Index Spot

Overview
Today last price100.24
Today Daily Change22
Today Daily Change %-0.04
Today daily open100.28
 
Trends
Daily SMA2099.92
Daily SMA5099.62
Daily SMA10098.78
Daily SMA20098.44
 
Levels
Previous Daily High100.56
Previous Daily Low100.15
Previous Weekly High100.4
Previous Weekly Low99.24
Previous Monthly High100.93
Previous Monthly Low98.81
Daily Fibonacci 38.2%100.4
Daily Fibonacci 61.8%100.31
Daily Pivot Point S1100.1
Daily Pivot Point S299.92
Daily Pivot Point S399.68
Daily Pivot Point R1100.51
Daily Pivot Point R2100.75
Daily Pivot Point R3100.93

Author

Pablo Piovano

Born and bred in Argentina, Pablo has been carrying on with his passion for FX markets and trading since his first college years.

More from Pablo Piovano
Share:

Editor's Picks

EUR/USD keeps the offered stance just above 1.1700

EUR/USD is coming under heavy selling pressure in what has been a rather grim start to the new trading week, with the pair now trading close to the 1.1700 support area as the US Dollar stages a solid rebound. The prevailing flight to safety mood continues to favour the Greenback, as investors react to the escalating conflict in the Middle East and trim risk exposure across the board.

GBP/USD hits new yearly lows near 1.3300

GBP/USD adds to the recent bearish tone, approaching to the key 1.3300 support to reach fresh YTD troughs against the backdrop of the robust performance of the US Dollar. Indeed, Cable’s decline comes amid the firm demand for the safe-haven space in the wake of the US and Israel attacks to Iran.

Gold battles to retain the positive momentum

Gold now surrenders part of the earlier advance past the $5,400 mark per troy ounce at the beginning of the week. Indeed, the precious metal’s strong uptick remains fuelled by increasing geopolitical tensions in the Middle East amid the intense demand for safer assets.

Bitcoin on brink of breakdown amid US-Iran war

Bitcoin (BTC) remains under pressure near the key support level of $65,700. Trading at $66,400 at the time of writing on Monday, a breakdown below this critical level would suggest a deeper correction ahead.

The Fed is finally talking about AI – Here's why it matters for the US Dollar

AI is moving from earnings calls into the heart of monetary policy discussions, forcing Federal Reserve officials to confront a new question: How to act if AI reshapes inflation, employment and interest rates at the same time?

Grass 20% bullish breakout defies broader market weakness

Grass (GRASS) is edging up above $0.30 at the time of writing on Monday. The token’s notable 20% intraday surge stands out amid heightened volatility in the broader crypto market.