US Dollar Index challenges 4-month lows around 95.80, looks to Fed


  • DXY accelerates the downside to the 95.80 region.
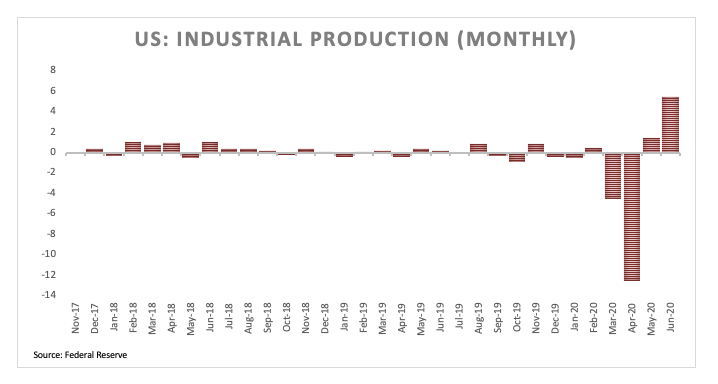
  • US Industrial Production rebounded more than estimated in June.
  • The Fed’s Beige Book will close the daily US docket later in the session.

The greenback, when measured by the US Dollar Index (DXY), remains under heavy pressure and navigates at shouting distance from June’s lows near 95.70.

US Dollar Index hurt by risk-on sentiment

The index is down for the fourth session in a row on Wednesday, breaking below the support at the 96.00 neighbourhood – where coincide a Fibo level (of the 2017-2018 drop) and therefore opening the door to a probable move to June’s low at 95.71 (June 10).

The greenback, as well as its safe haven peers, remains well on the defensive in a context totally dominated by the risk appetite mood, in turn bolstered by rising optimism on a coronavirus vaccine and a strong (‘V’-shaped?) rebound in the economic activity.

In the docket, positive results only added to the upbeat sentiment after the NY Empire State Index reclaimed the positive territory in July and Industrial Production expanded 5.4% inter-month in June. In addition, Manufacturing Production expanded 7.2% MoM and the Capacity Utilization Rate ticked higher to 68.6%. Later in the session, the Fed will publish the Beige Book.

What to look for around USD

The relentless advance of the COVID-19 pandemic in the US and across the world vs. news of a potential vaccine that could be developed before markets’ expectations plus the ongoing reopening of global economies are all driving the sentiment in the global markets and keep the dollar under pressure. On the constructive view of the dollar, bouts of risk aversion should support the investors’ preference for the greenback as a safe haven along with its status of global reserve currency and store of value.

US Dollar Index relevant levels

At the moment, the index is losing 0.28% at 95.92 and faces the next support at 95.72 (monthly low Jun.10) followed by 94.65 (2020 low Mar.9) and then 93.81 (monthly low Sep.21 2018). On the other hand, a break above 97.80 (weekly high Jun.30) would aim for 97.87 (61.8% Fibo of the 2017-2018 drop) and finally 98.22 (200-day SMA).

Share: Feed news

Information on these pages contains forward-looking statements that involve risks and uncertainties. Markets and instruments profiled on this page are for informational purposes only and should not in any way come across as a recommendation to buy or sell in these assets. You should do your own thorough research before making any investment decisions. FXStreet does not in any way guarantee that this information is free from mistakes, errors, or material misstatements. It also does not guarantee that this information is of a timely nature. Investing in Open Markets involves a great deal of risk, including the loss of all or a portion of your investment, as well as emotional distress. All risks, losses and costs associated with investing, including total loss of principal, are your responsibility. The views and opinions expressed in this article are those of the authors and do not necessarily reflect the official policy or position of FXStreet nor its advertisers. The author will not be held responsible for information that is found at the end of links posted on this page.

If not otherwise explicitly mentioned in the body of the article, at the time of writing, the author has no position in any stock mentioned in this article and no business relationship with any company mentioned. The author has not received compensation for writing this article, other than from FXStreet.

FXStreet and the author do not provide personalized recommendations. The author makes no representations as to the accuracy, completeness, or suitability of this information. FXStreet and the author will not be liable for any errors, omissions or any losses, injuries or damages arising from this information and its display or use. Errors and omissions excepted.

The author and FXStreet are not registered investment advisors and nothing in this article is intended to be investment advice.

Recommended content


Recommended content

Editors’ Picks

EUR/USD clings to gains above 1.0750 after US data

EUR/USD clings to gains above 1.0750 after US data

EUR/USD manages to hold in positive territory above 1.0750 despite retreating from the fresh multi-week high it set above 1.0800 earlier in the day. The US Dollar struggles to find demand following the weaker-than-expected NFP data.

EUR/USD News

GBP/USD declines below 1.2550 following NFP-inspired upsurge

GBP/USD declines below 1.2550 following NFP-inspired upsurge

GBP/USD struggles to preserve its bullish momentum and trades below 1.2550 in the American session. Earlier in the day, the disappointing April jobs report from the US triggered a USD selloff and allowed the pair to reach multi-week highs above 1.2600.

GBP/USD News

Gold struggles to hold above $2,300 despite falling US yields

Gold struggles to hold above $2,300 despite falling US yields

Gold stays on the back foot below $2,300 in the American session on Friday. The benchmark 10-year US Treasury bond yield stays in negative territory below 4.6% after weak US data but the improving risk mood doesn't allow XAU/USD to gain traction.

Gold News

Bitcoin Weekly Forecast: Should you buy BTC here? Premium

Bitcoin Weekly Forecast: Should you buy BTC here?

Bitcoin (BTC) price shows signs of a potential reversal but lacks confirmation, which has divided the investor community into two – those who are buying the dips and those who are expecting a further correction.

Read more

Week ahead – BoE and RBA decisions headline a calm week

Week ahead – BoE and RBA decisions headline a calm week

Bank of England meets on Thursday, unlikely to signal rate cuts. Reserve Bank of Australia could maintain a higher-for-longer stance. Elsewhere, Bank of Japan releases summary of opinions.

Read more

Forex MAJORS

Cryptocurrencies

Signatures