|

US Dollar Index Asia Price Forecast: Largest QE operation ever for worst crisis in history? DXY clings to 3-year’s highs

  • DXY consolidates gains after an exceptional spike up.
  • The level to beat for bulls is the 103.00 figure. 
  • Fed launches the largest stimulus program in history in response to the coronavirus crisis.
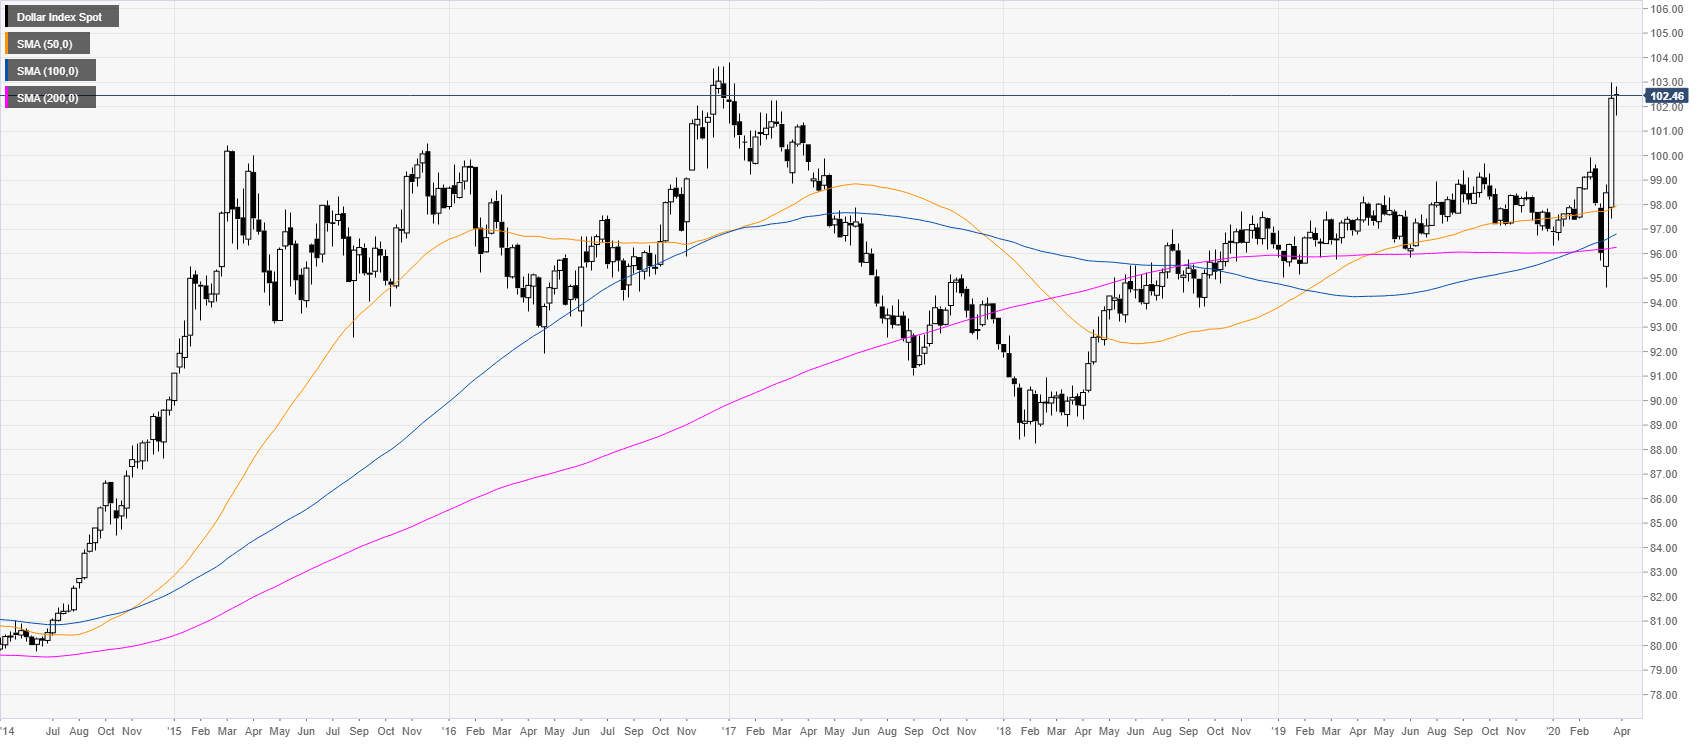
 

DXY weekly chart

 
DXY (US dollar index) is trading near its highest since January 2017 as USD is benefitting from above-average buying interest. Interestingly, the 2020 stock crash is one of the steepest and fastest declines the market ever experienced. Therefore, the Federal Reserve of the United States announced today that there would be no limit to how much it will support the economy through Quantitative Easing (QE). Essentially, yes, this is more USD printing which should, in theory, devalue the US dollar, but by doing QE unlimited, the Fed is attracting investors which buy USD-denominated assets. This is the largest stimulus package the Fed ever issued in times of crisis, which is surely a sign that this financial crisis, if maybe not the worst, will probably not be a stroll in the park.
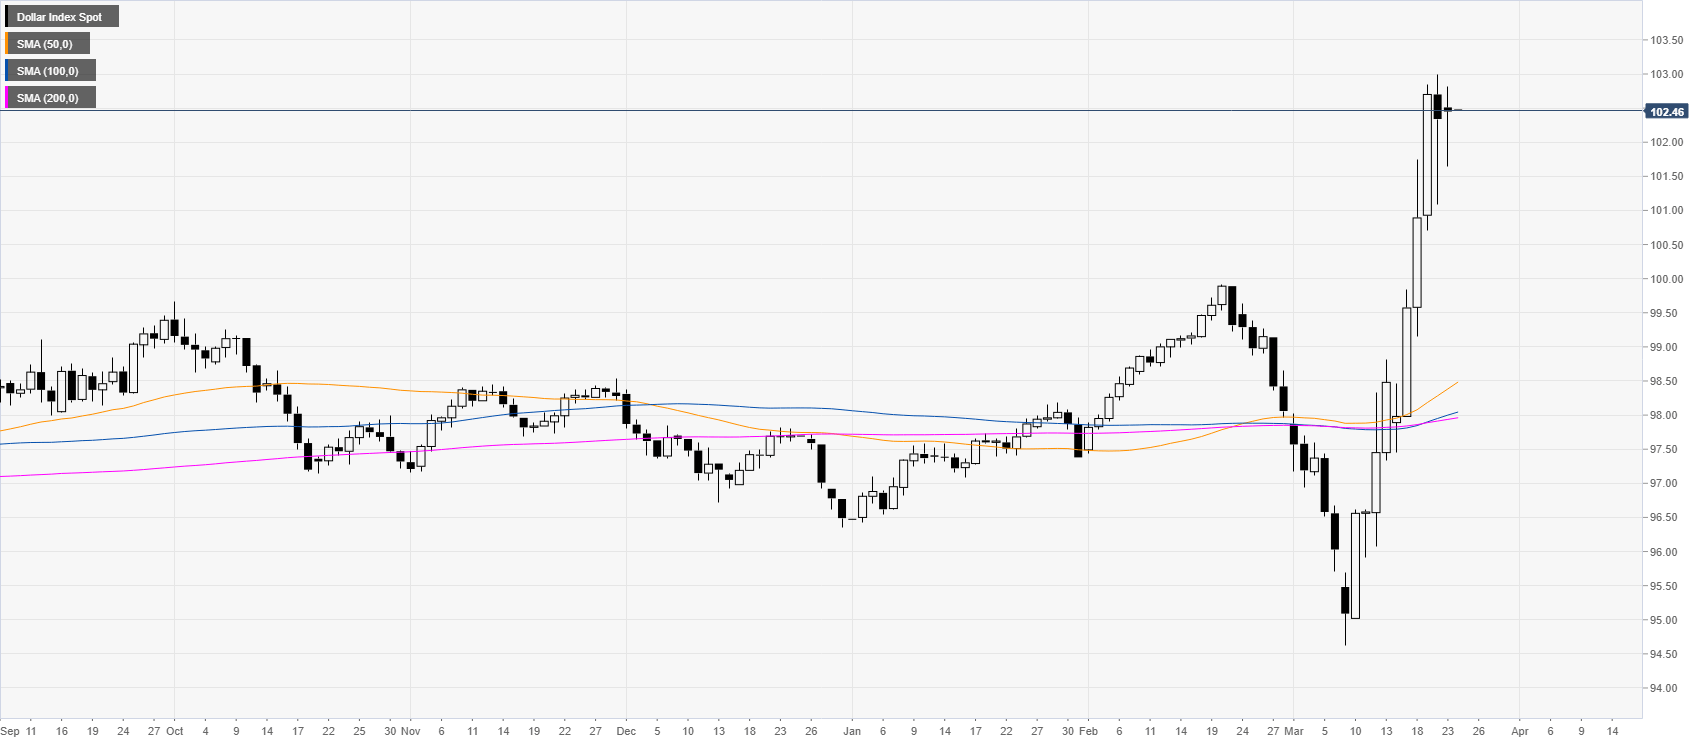
 

DXY daily chart

 
DXY is consolidating after an unusually strong spike to the upside as the market is trading well-above the main SMAs.
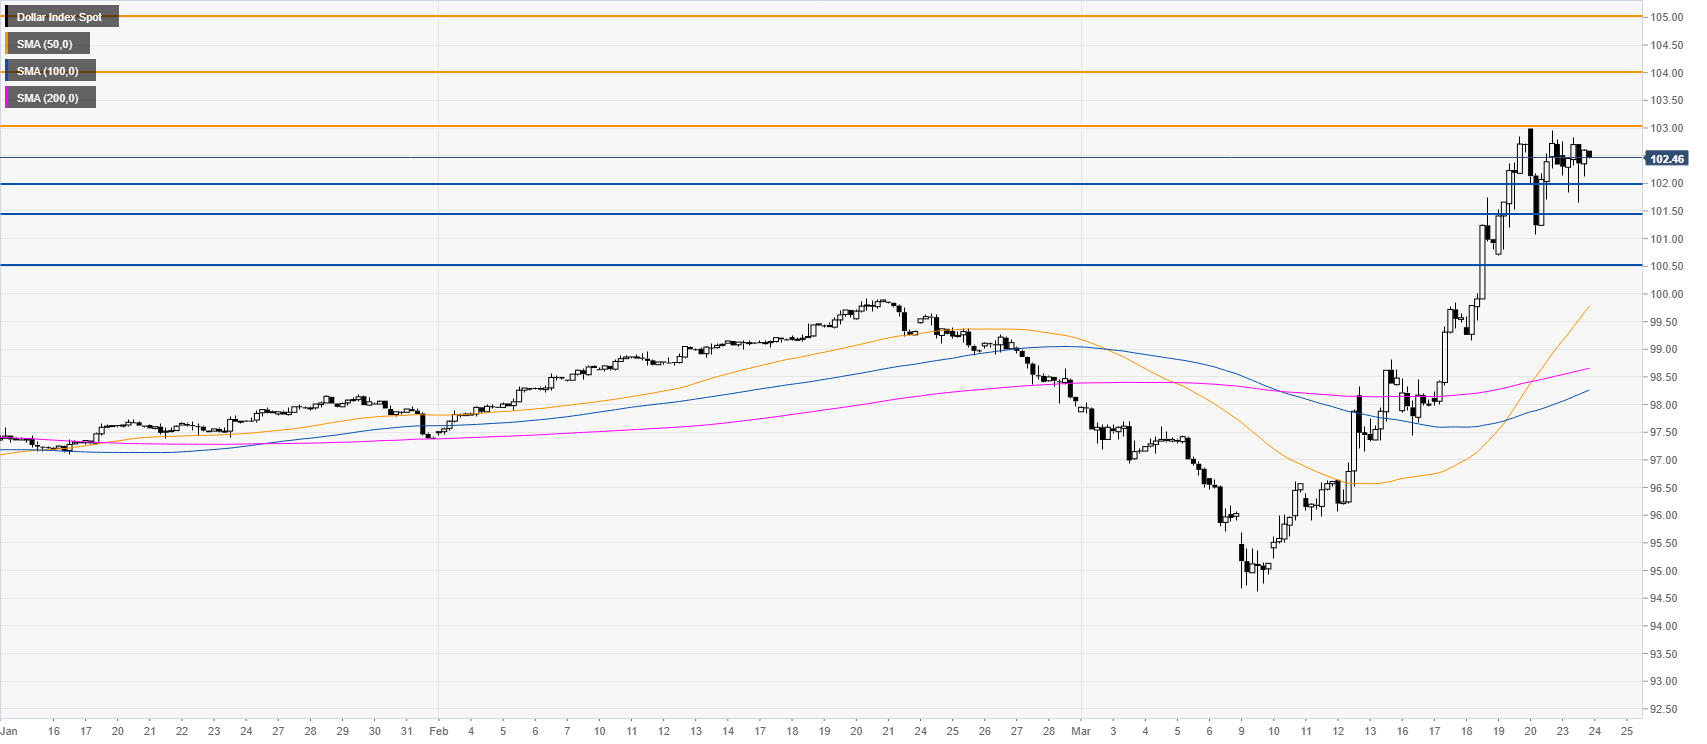
 

DXY four-hour chart

 
The bull trend remains intact as DXY is trading above its main SMAs. Pullback down are likely to remain shallow as DXY remains in high demand. Bulls are likely looking for a break above the 103.00 resistance which could introduce scope to the 104.00 and 105.00 figures in the coming sessions or weeks. The market is expected to find support near the 102.00, 101.50 and 100 levels on the way down. 
 

Additional key levels

Dollar Index Spot

Overview
Today last price102.45
Today Daily Change0.11
Today Daily Change %0.11
Today daily open102.34
 
Trends
Daily SMA2098.31
Daily SMA5098.28
Daily SMA10097.95
Daily SMA20097.91
 
Levels
Previous Daily High103
Previous Daily Low101.08
Previous Weekly High103
Previous Weekly Low97.45
Previous Monthly High99.91
Previous Monthly Low97.44
Daily Fibonacci 38.2%101.81
Daily Fibonacci 61.8%102.27
Daily Pivot Point S1101.28
Daily Pivot Point S2100.22
Daily Pivot Point S399.36
Daily Pivot Point R1103.2
Daily Pivot Point R2104.06
Daily Pivot Point R3105.12

Author

Flavio Tosti

Flavio Tosti

Independent Analyst


More from Flavio Tosti
Share:

Markets move fast. We move first.

Orange Juice Newsletter brings you expert driven insights - not headlines. Every day on your inbox.

By subscribing you agree to our Terms and conditions.

Editor's Picks

EUR/USD edges above 1.1750 due to ECB-Fed policy divergence

EUR/USD has recovered its recent losses registered in the previous session, trading around 1.1760 during the Asian hours on Friday. Traders will likely observe Germany’s Manufacturing Purchasing Managers’ Index data later in the day.

GBP/USD gathers strength above 1.3450 on Fed rate cut bets, BoE's gradual policy path

The GBP/USD pair gathers strength to around 1.3480 during the early Asian session on Friday. Expectations of the US Federal Reserve rate cuts this year weigh on the US Dollar against the Pound Sterling. Philadelphia Fed President Anna Paulson is set to speak later on the weekend. 

Gold climbs to near $4,350 on Fed rate cut bets, geopolitical risks

Gold price rises to near $4,345 during the early Asian session on Friday. Gold finished 2025 with a significant rally, achieving an annual gain of around 65%, its biggest annual gain since 1979. The rally of the precious metal is bolstered by the prospect of further US interest rate cuts in 2026 and safe-haven flows.

Bitcoin, Ethereum and Ripple enter the New Year with breakout hopes

Bitcoin, Ethereum, and Ripple entered the new year trading at key technical levels on Friday, as traders seek fresh directional cues in January. With BTC locked in a tight range, ETH is approaching its 50-day Exponential Moving Average, while XRP is nearing resistance. A clear breakout across these top three cryptocurrencies could help define market momentum in the opening weeks of the year.

Economic outlook 2026-2027 in advanced countries: Solidity test

After a year marked by global economic resilience and ending on a note of optimism, 2026 looks promising and could be a year of solid economic performance. In our baseline scenario, we expect most of the supportive factors at work in 2025 to continue to play a role in 2026.

Crypto market outlook for 2026

Year 2025 was volatile, as crypto often is.  Among positive catalysts were favourable regulatory changes in the U.S., rise of Digital Asset Treasuries (DAT), adoption of AI and tokenization of Real-World-Assets (RWA).