TSLA Stock Price and Forecast: Why did Tesla shares fall?
- Tesla stock was strong in Thursday's premarket after the CEO share sale.
- TSLA shares could not hold those gains and closed down on the day.
- CEO Elon Musk followed through on his Twitter poll promise and sold a large amount.

Tesla (TSLA) stock looked to be in a strong position just as the market opened on Thursday. The stock was trading over 2% higher in the premarket, and the shares in Frankfurt were up over 4% at one stage. However, the stock had a brief look higher just after the open before quickly coming straight back down and closing lower. A quick red-to-green or in this case green-to-red flip is always a well-watched signal, and this one does set alarm bells ringing. The stock has had a huge run, but now the CEO has sold stock, inflation is rising, and so are yields. Tesla is going to struggle from here.
-637723054525102261.png)
Tesla (TSLA) chart, 15-minute
Tesla (TSLA) stock news
Elon Musk has been in the news again as usual. He ran a Twitter poll about selling some of his shares. The poll was in favour, and he duly obliged, selling or exercising about $5 billion worth of stock or stock options. This obviously had a knock-on effect on the Tesla (TSLA) share price.
Rivian (RIVN) IPO'd on Wednesday, and the shine spread across the electric vehicle sector. However, Elon Musk has attempted to urge some caution over the Rivian launch, saying, "There have been hundreds of automotive startups, both electric and combustion, but Tesla is (the) only American carmaker to reach high volume production & positive cash flow in past 100 years," ..."I hope they're (Rivian) able to achieve high production and breakeven cash flow. That is the true test." The gauntlet has been thrown down then. Tesla is facing increased competition from new entrants to the market, such as Lucid Motors (LCID) and Rivian (RIVN), as well as from existing auto manufacturers going fully or partially electric.
Tesla (TSLA) stock forecast
It is a perfect set up now for more losses. The retracement on Thursday stopped right on the 9-day moving average resistance at $1,102. Beyond that $1,120 is also strong. The failure on Thursday puts $1,000 firmly as the first target, and once through there the gap to $910 needs to be filled. The Moving Average Convergence Divergence (MACD) and stochastic remain crossed into sell signals.
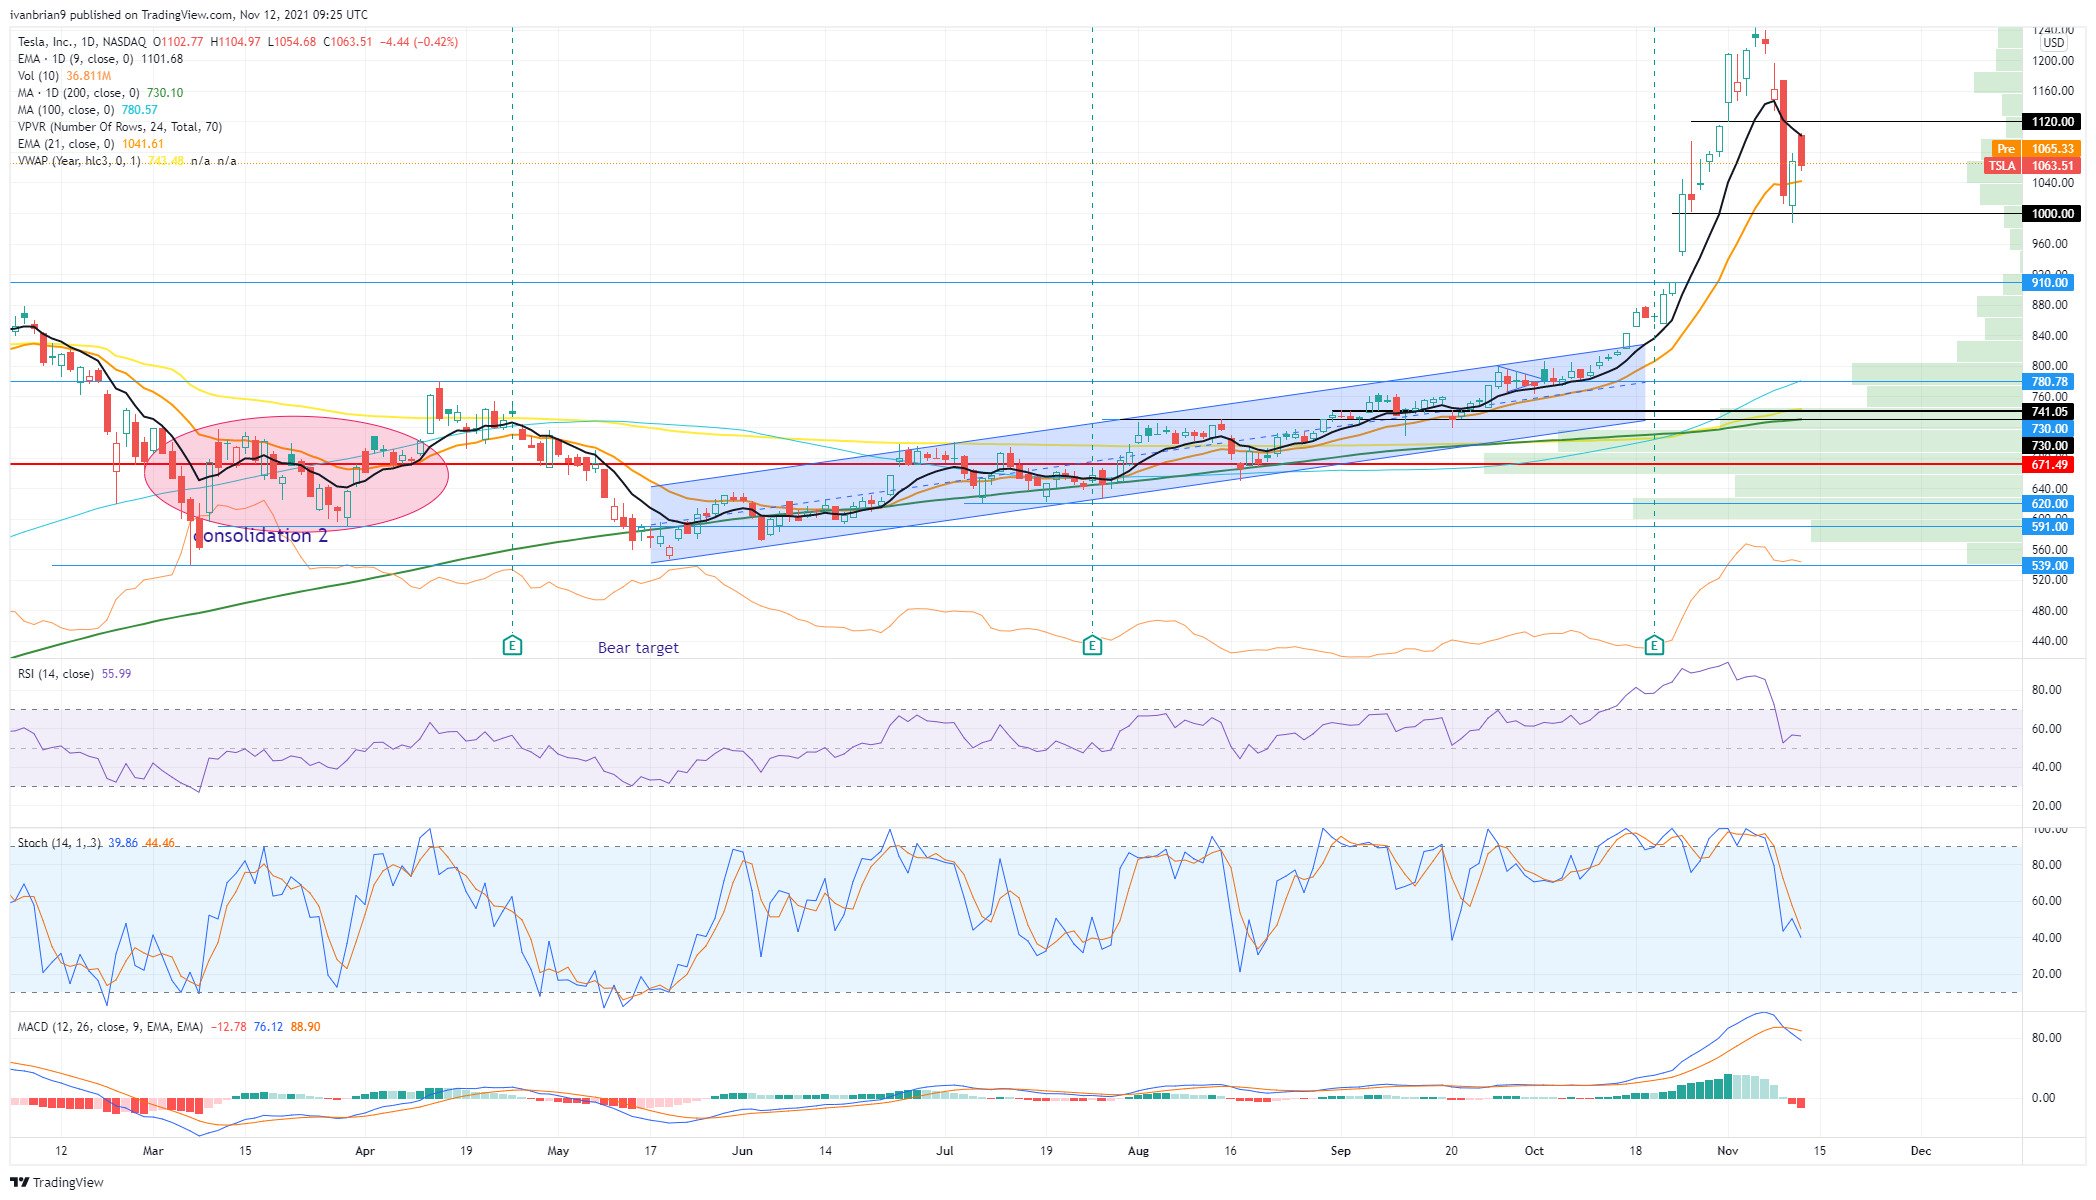
TSLA 1-day chart
Author

Ivan Brian
FXStreet
Ivan Brian started his career with AIB Bank in corporate finance and then worked for seven years at Baxter. He started as a macro analyst before becoming Head of Research and then CFO.


