Tesla Stock Price and News: Why did TSLA hold the 200-day moving average?
- Tesla reverses into autopilot and is charged up for more gains.
- TSLA stock bounces from the 200-day moving average.
- Tesla should see further gains on Friday as global equities recover.

Tesla (TSLA) stock had a rollercoaster ride on Thursday as much of the global equity sphere were in choppy waters. Investors were spooked by a global rout in bond yields with German and US yields falling sharply. This spooked equity investors who reignited fears over global growth issues in the wake of the Delta covid variant.
Tesla opened Thursday's session in pretty bad shape and was quickly down 2.5% and briefly broke the 200-day moving average. But this was quickly rebutted, and Tesla staged an impressive reversal maneuver without using cameras! The stock rallied for the remainder of the afternoon and closed in the green, up 1.3% at $652.81.
-637614300927266885.png)
Tesla key statistics
| Market Cap | $629 billion |
| Price/Earnings | 645 |
| Price/Sales | 23 |
| Price/Book | 28 |
| Enterprise Value | $753 billion |
| Gross Margin | 0.21 |
| Net Margin |
0.03 |
| Average Wall Street Rating and Price Target | Hold, $657 |
Why is Tesla stock down?
Tesla shares had retreated on Wednesday and early on Thursday as investors took a dim view of the potential read-across from the DIDI saga. Tesla has had some data concerns in relation to China previously with issues over cameras and car data.
Reuters reported on May 25 that Tesla had set up a local site in China to store car data. A previous story from Reuters on May 21 reported that Tesla cars were barred from some government compounds due to concerns over cameras installed in the Tesla vehicles.
Wedbush analyst Daniel Ives said, "The Didi move from Beijing has sent nervousness to China-exposed names such as Tesla. [...] China and Tesla continue to be in a regulatory back and forth that is concerning investors."
Also perhaps weighing on Tesla was a tweet sent by Tesla CEO Elon Musk over the weekend in which he said he did not expect self-driving to be too difficult. "Generalized self-driving is a hard problem, as it requires solving a large part of real-world AI. Didn’t expect it to be so hard, but the difficulty is obvious in retrospect. Nothing has more degrees of freedom than reality."
Why was Tesla stock up Thursday?
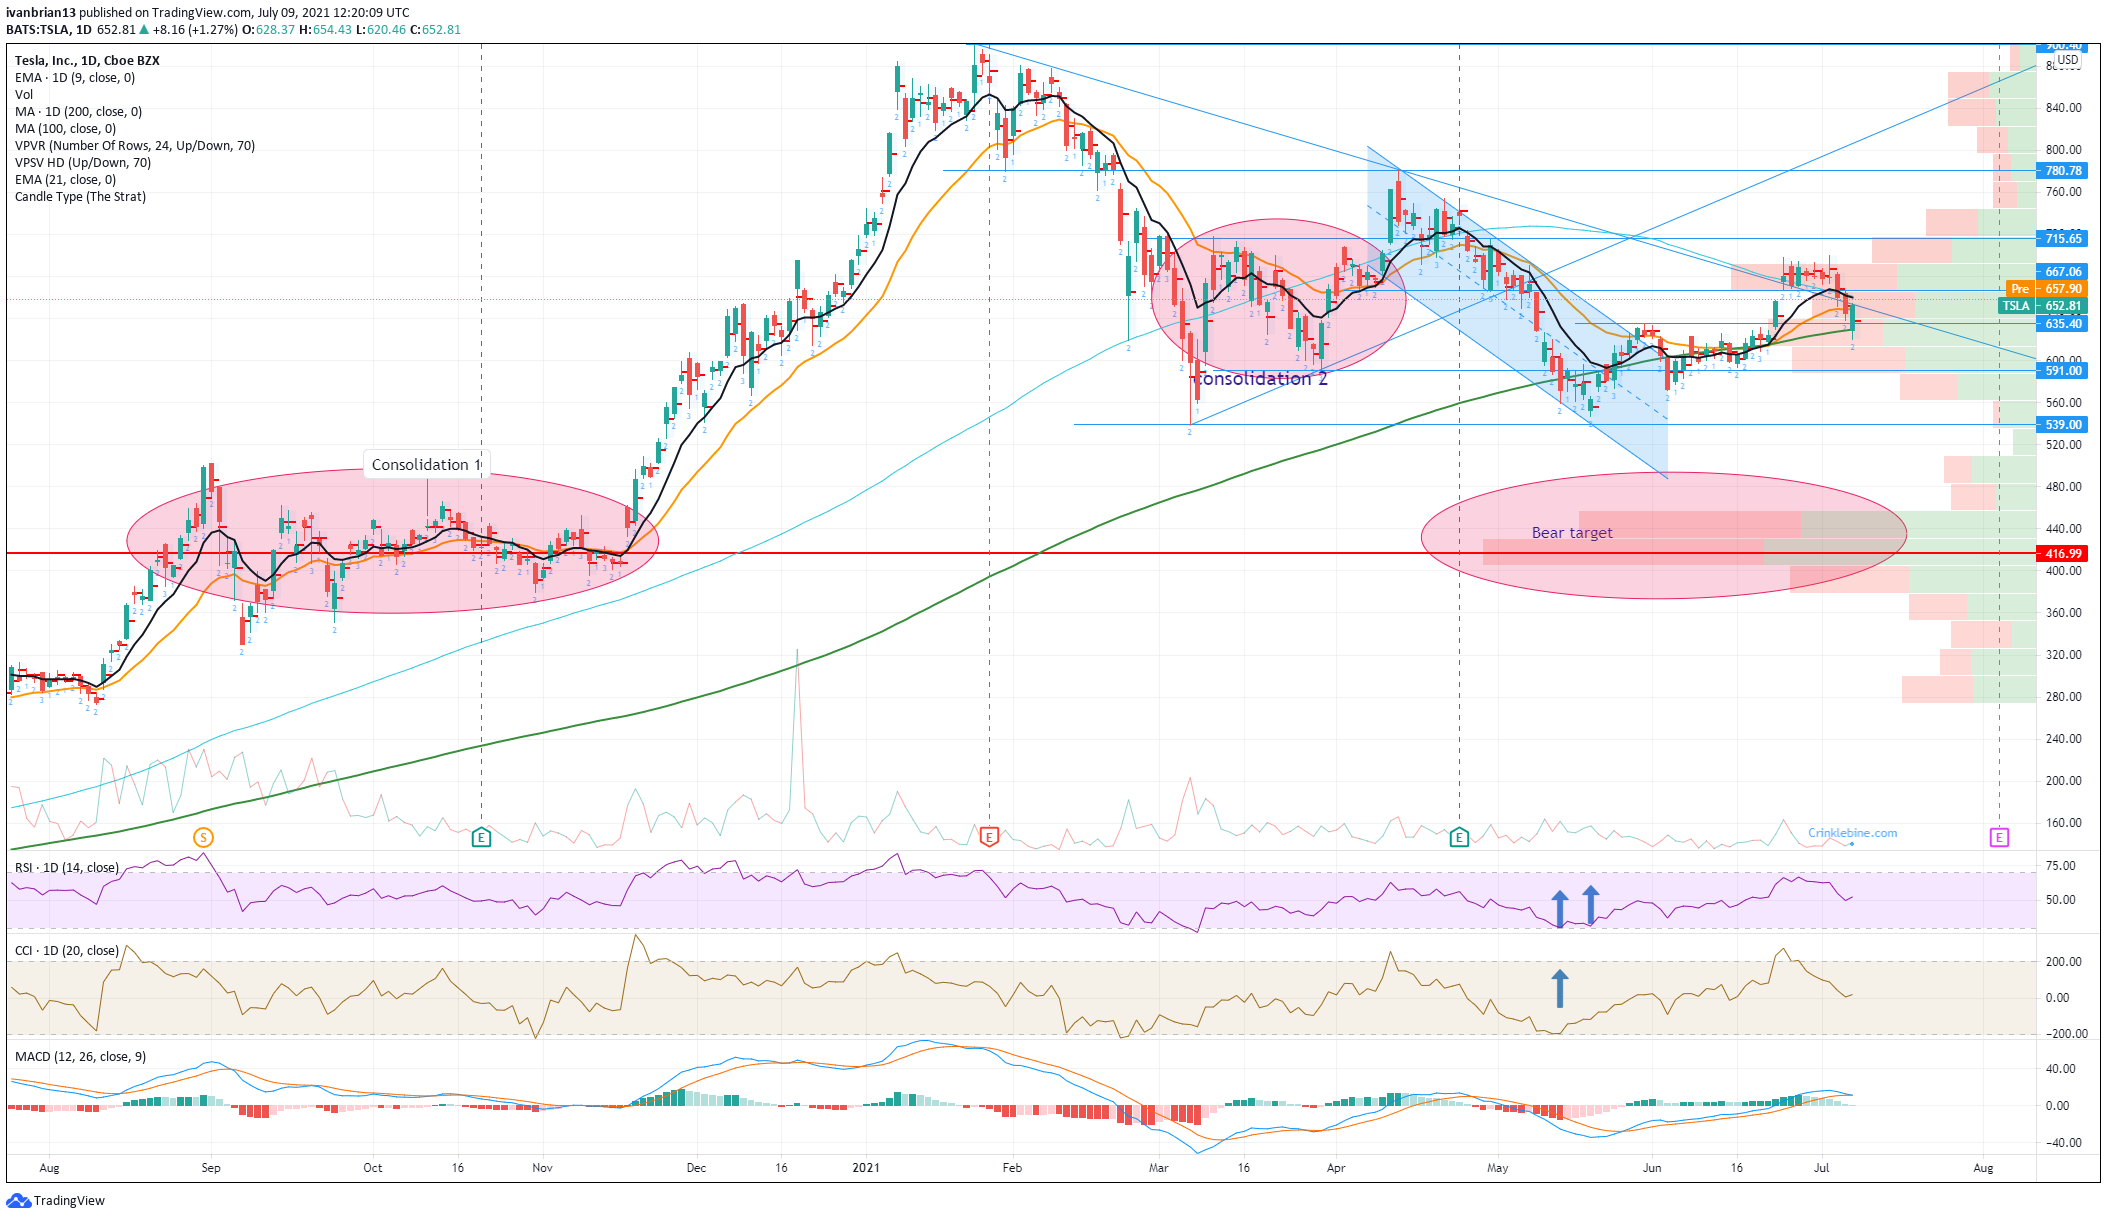
Thursday saw a strong turnaround, reversal is too easy a pun for this author! The move was impressive and showed that traders took note of the 200-day moving average (MA) and also this showed how well the volume profile works to identify areas of support and resistance. The volume profile shows the volume at each price level. The more volume then the more importance is attached to that price level. In the case of Tesla, the area under $635 has a lot of volume and acts as strong support. When adding in the 200-day MA this just adds to the strength of the zone. We had previously identified $635 as key resistance and a point at which the price could accelerate once broken as volume thinned out above. This happened perfectly in mid-June and so a retracement to the level found support.
Tesla stock forecast
Holding the 200-day is important but has not turned things bullish in one easy go. The short-term trend is still neutral to lower as the 9 and 21-day moving averages are above here and are flat. The Moving Average Convergence Divergence (MACD) indicator is also very close to crossing into a bearish sign, so keep an eye here. However, this is not a bad area to try for a buy-the-dip long position. A stop below $620, Thursday's low, would initially be the correct strategy, and see if the momentum can continue on Friday. Getting back above $667 is the real prize bulls seek as this retraces all the losses of this week and brings us back to a point of stabilization and high volume. This could then be a staging point for a push above $715. Above this $715 resistance, the move should accelerate as volume is light.
Like this article? Help us with some feedback by answering this survey:
Premium
You have reached your limit of 3 free articles for this month.
Start your subscription and get access to all our original articles.
Author

Ivan Brian
FXStreet
Ivan Brian started his career with AIB Bank in corporate finance and then worked for seven years at Baxter. He started as a macro analyst before becoming Head of Research and then CFO.


