Tesla (TSLA) Stock Price and Forecast: Rallies hard to six-week highs above $650
- Tesla stock breaks the big $635 resistance level and the move accelerates.
- TSLA spikes 5% on the move as buyers chase the gap move.
- $667 above is the next level but heavy volume here will make it tough to break.

Update June 24: TSLA stock rallied hard on Wednesday after a powerful breach of the $635 critical resistance. Tesla shares jumped over 5% to reach the highest levels in six weeks at $657.12. In post-market trading, the stock added another 1% to finish at $663.30. The technical breakout was one of the key catalysts behind the price surge. The latest news that Tesla launched its first charging station in China with an energy storage function for electric vehicles triggered the blistering rally.
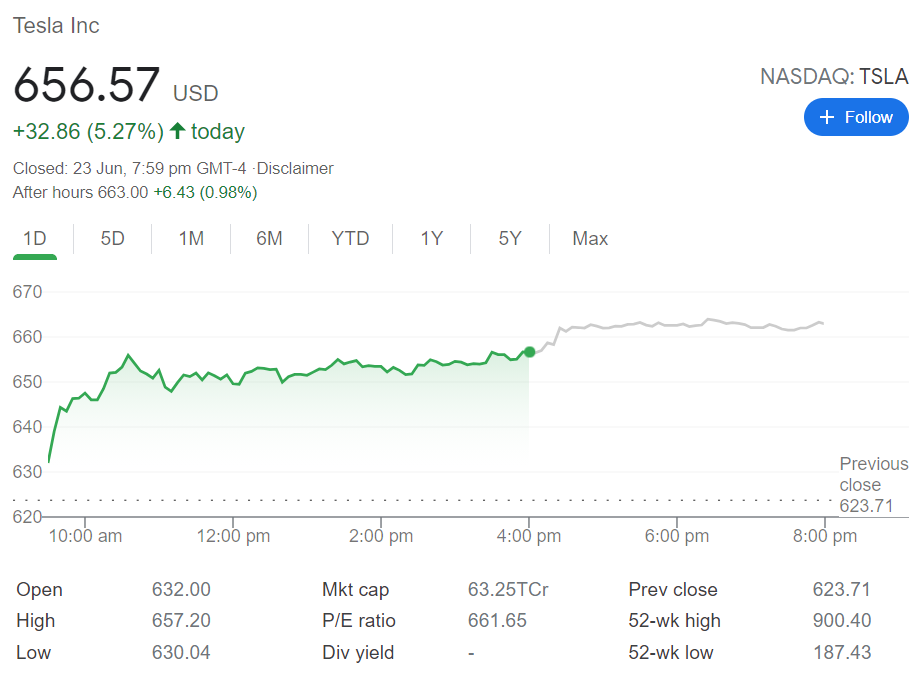
Tesla key statistics
| Market Cap | $601 billion |
| Price/Earnings | 621 |
| Price/Sales | 21 |
| Price/Book | 26 |
| Enterprise Value | $753 billion |
| Gross Margin | 21% |
| Net Margin |
3% |
| Average Wall Street Rating and Price Target | Hold, $652 |
Tesla stock forecast
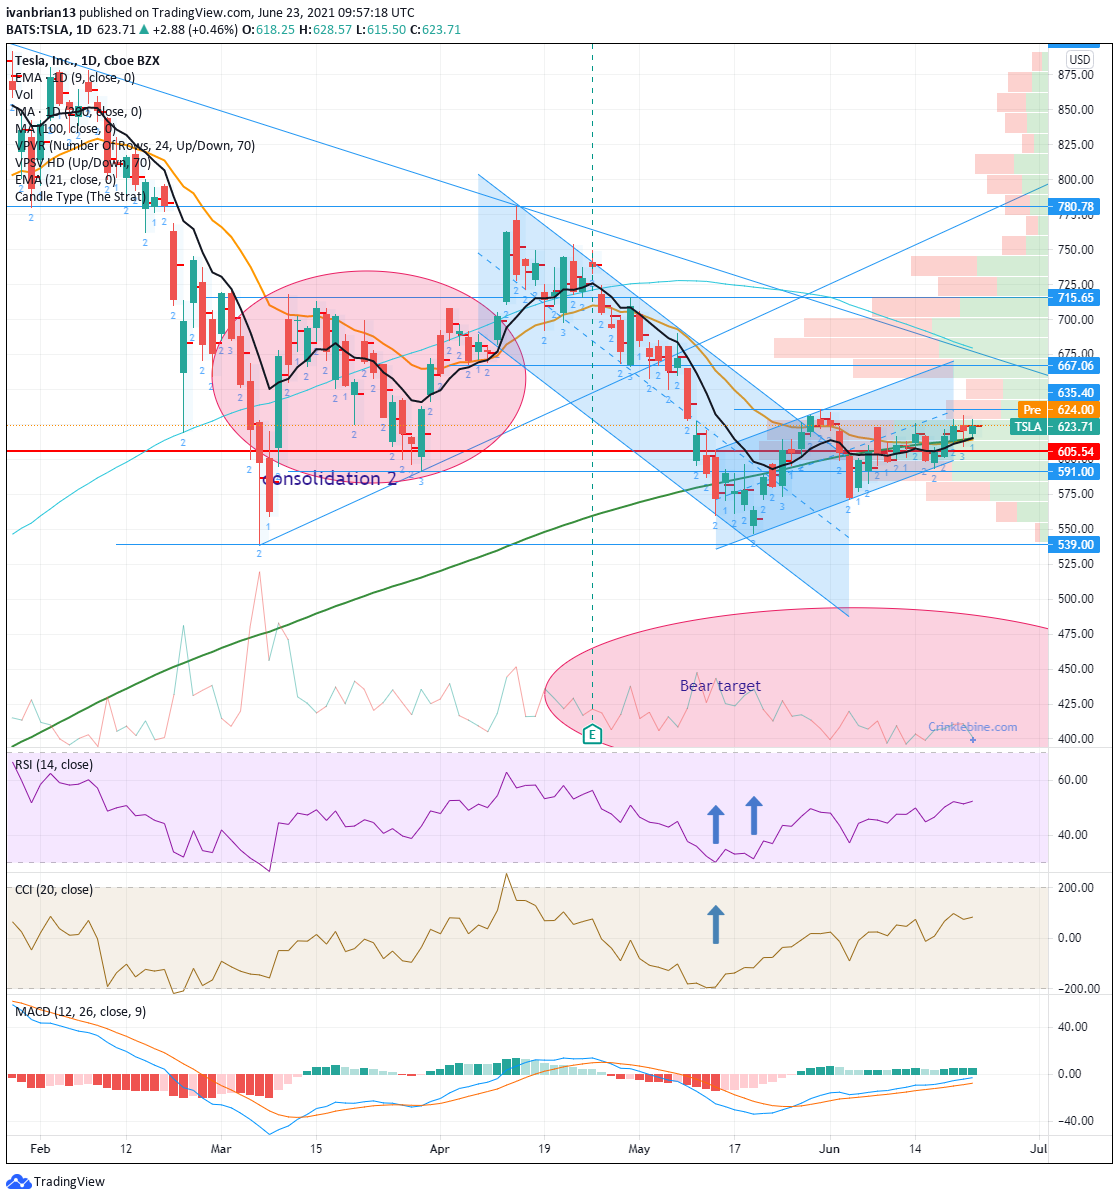
Tuesday's move continued the recent slow but steady progress Tesla shares have been making. Importantly, the 9-day moving average is now acting as a nice guide for support to higher levels. The 200-day moving average is also finally starting to recede into the distance. Tuesday's candle was a continuation and crucially green and bullish as Monday was a bit indecisive. Monday saw a red engulfing candle as traders struggled for directional bias. Tellingly, the volume profile on both days was skewed toward the high end of the daily range.
For now, the short-term risk-reward remains skewed marginally to the upside. $635 really is a better entry point for fresh longs as a break is bullish and should lead to renewed momentum. The volume profile to the right of the chart shows how volume drops off above $635 and does not kick in until $660, so a break should accelerate. Traders already long should keep an eye on the 9-day moving average, which is currently guiding higher. Because of this it is best to use a trailing stop to try and ride the hopeful trend higher. Momentum indicators are beginning to also tick higher and confirm the price action. Both Relative Strength Index (RSI) and Commodity Channel Index (CCI) remain in neutral territory.
Previous updates
Update: The early powerful break which we called (see below) has been sustained and the stock looks set to register a powerful bullish candle. At the time of writing with just over one hour left in the regular session TSLA stock is trading at $653.85 up nearly 5%. The hourly chart below shows just how thin volume was (red/green bars on the right of the chart) above $635 which was also the May 28 high, so a key level.
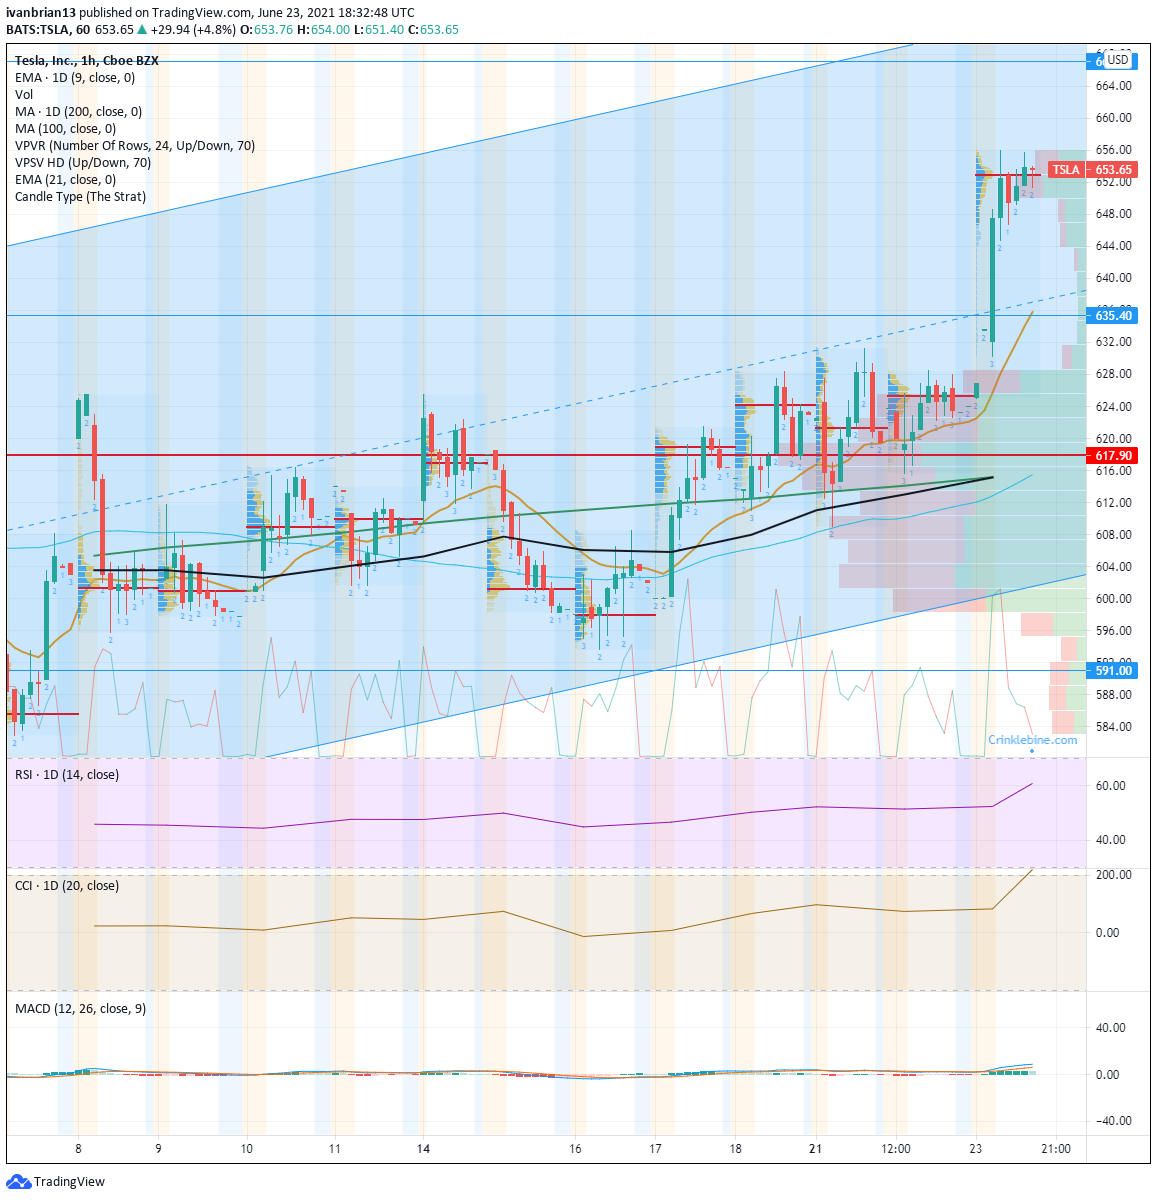
Update: It is nice when things work out and some nice calls on Bitcoin and Tesla this morning have helped reaffirm the importance of the technical views in equity markets. Tesla broke the key $635 level we identified and accelerated through it as we also predicted. "The volume profile to the right of the chart shows how volume drops off above $635 and does not kick in until $660, so a break should accelerate," our call from this morning. Tesla's Model was named in number 1 spot by cars.com's American-made index and Bitcoin bouncing has also helped sentiment.
Tesla shares are still struggling for direction but are moving in the right direction, albeit slowly. Tuesday saw further small gains as the stock closed up just 0.4% at $623.71. The electric vehicle sector leader has been making steady progress since bottoming out in early March at $539. Tesla returned to test this support zone in late May and has been trading along with the 200-day moving average ever since.
-637600540484705645.png)
Like this article? Help us with some feedback by answering this survey:
Premium
You have reached your limit of 3 free articles for this month.
Start your subscription and get access to all our original articles.
Author

Ivan Brian
FXStreet
Ivan Brian started his career with AIB Bank in corporate finance and then worked for seven years at Baxter. He started as a macro analyst before becoming Head of Research and then CFO.


