Tesla Stock Price and Forecast: Is TSLA about to crash to $910 as Rivian and Lucid fall?
- TSLA stock falls sharply on Friday in a panic sell-off.
- Tesla shares break below key $1120 support level.
- Next support seen at $1,000 and then $910.

Tesla (TSLA) stock fell by over 3% on Friday in a combination of panic selling as a new covid variant appears to be sweeping the world and a general lack of liquidity due to Thanksgiving festivities. We are now officially in the festive season and it remains to be seen whether we get the much anticipated Christmas rally. Equity markets were heavily spooked late last week as the new covid variant was discovered in South Africa. This led to oil suffering one of its largest one-day falls ever and stocks going into freefall. Tesla fell over 3% in what, by comparison with some other names, was not as bad as feared. The stock remains strong but if profit-taking hits ahead of year-end there could be more falls in store for the electric vehicle leader.
-637737764211629095.png)
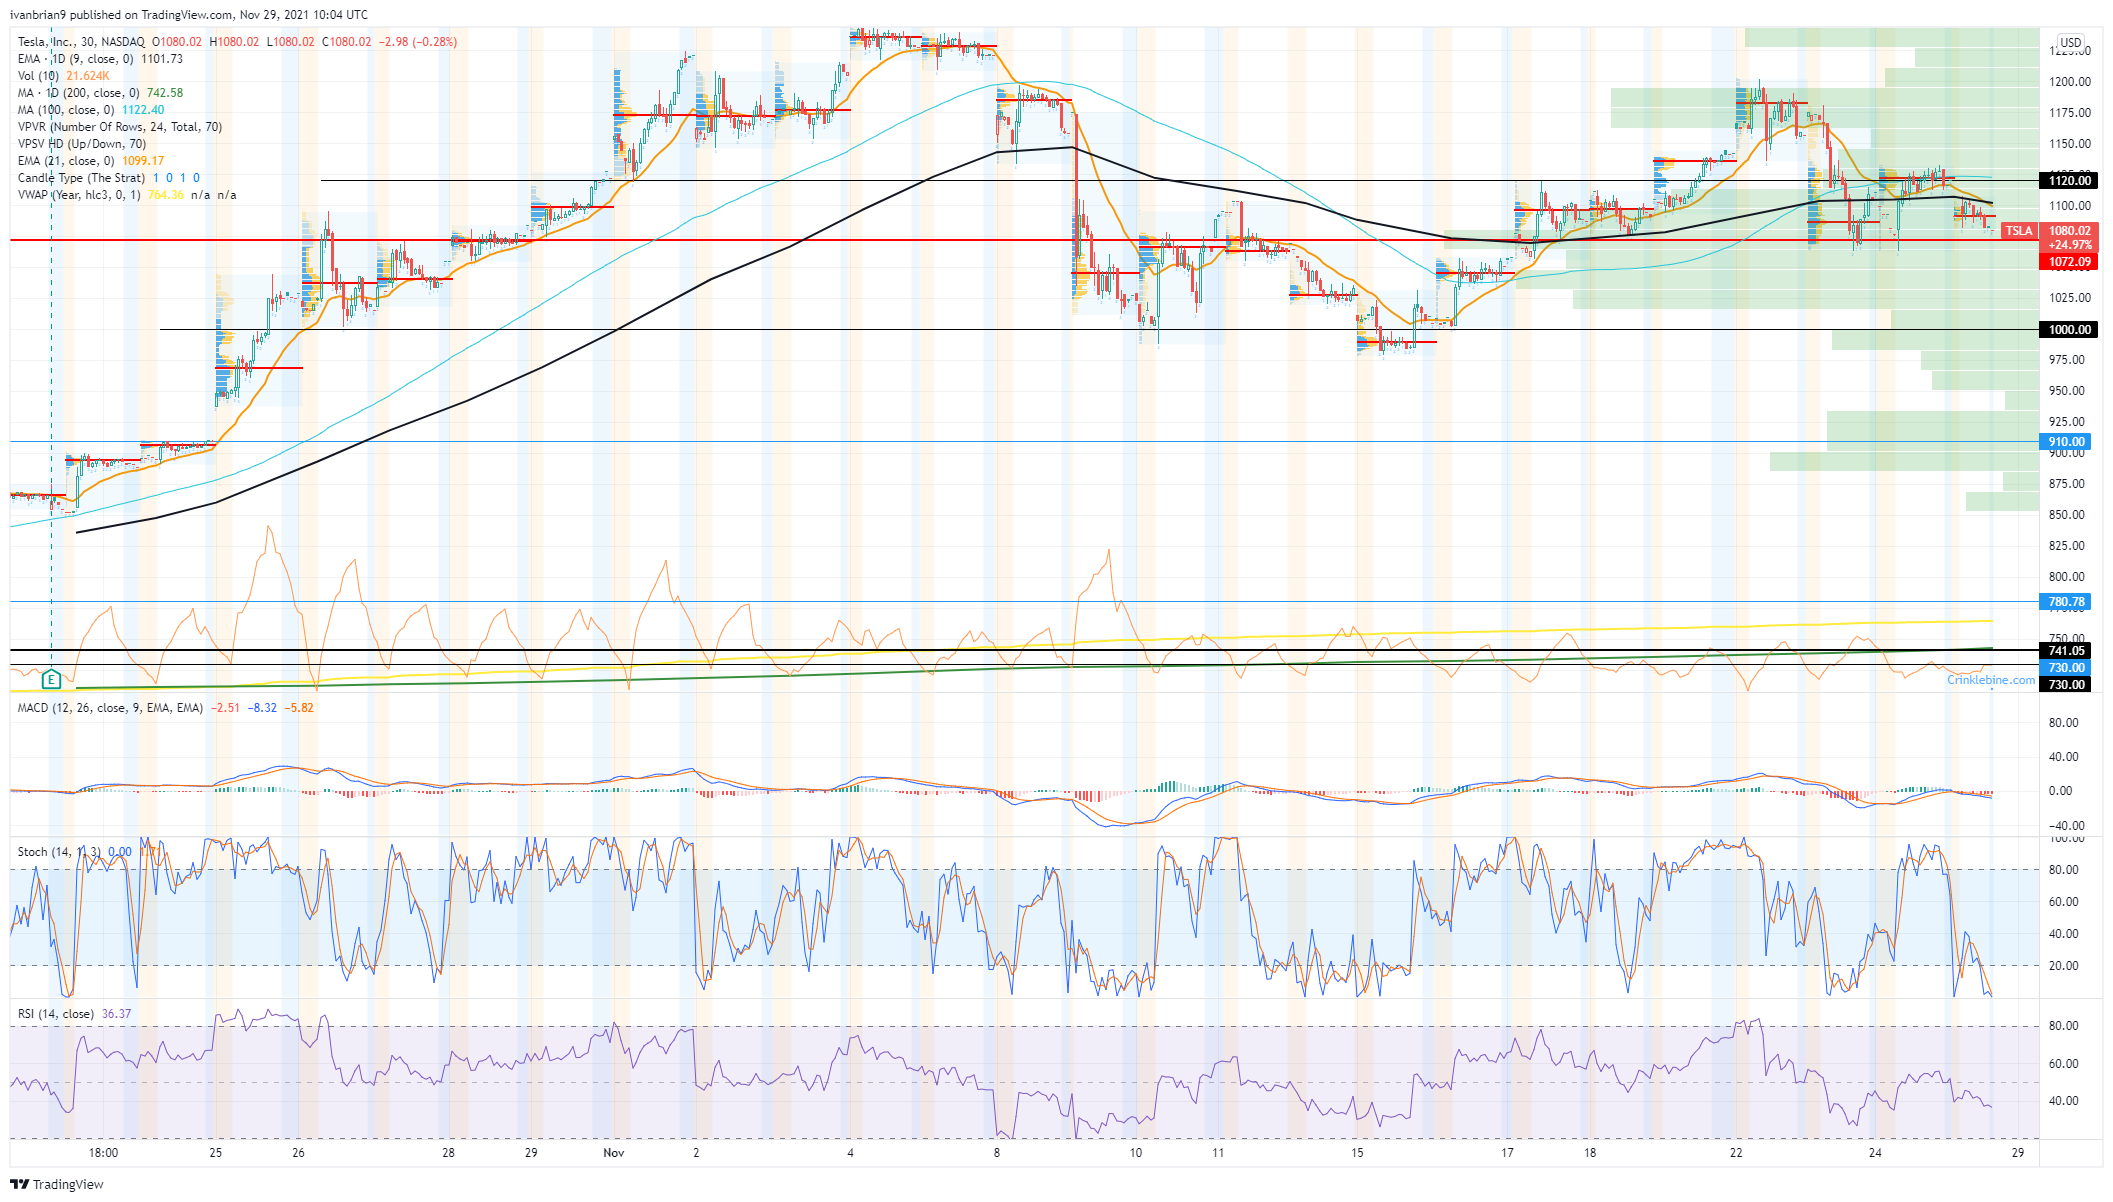
As we can see from our intraday chart above for Tesla (TSLA), it fell nearly 8% last week so the trend was already in place before Friday's acceleration.
Tesla stock news
After last quarter's "super hardcore" urging from boss Elon Musk, Tesla workers are now being urged to focus on costs. An email from Musk to employees was cited by CNBC as focusing on reducing the cost of deliveries for this quarter instead of actual delivery numbers. "Per my email several weeks ago, our focus this quarter should be on minimizing the cost of deliveries rather than spending heavily on expediting fees, overtime and temporary contractors just so that cars arrive in Q4,"..."The right principle is to take the most efficient action, as though we were not publicly traded and the notion of "end of quarter" didn't exist," Musk added.
TSLA stock forecast
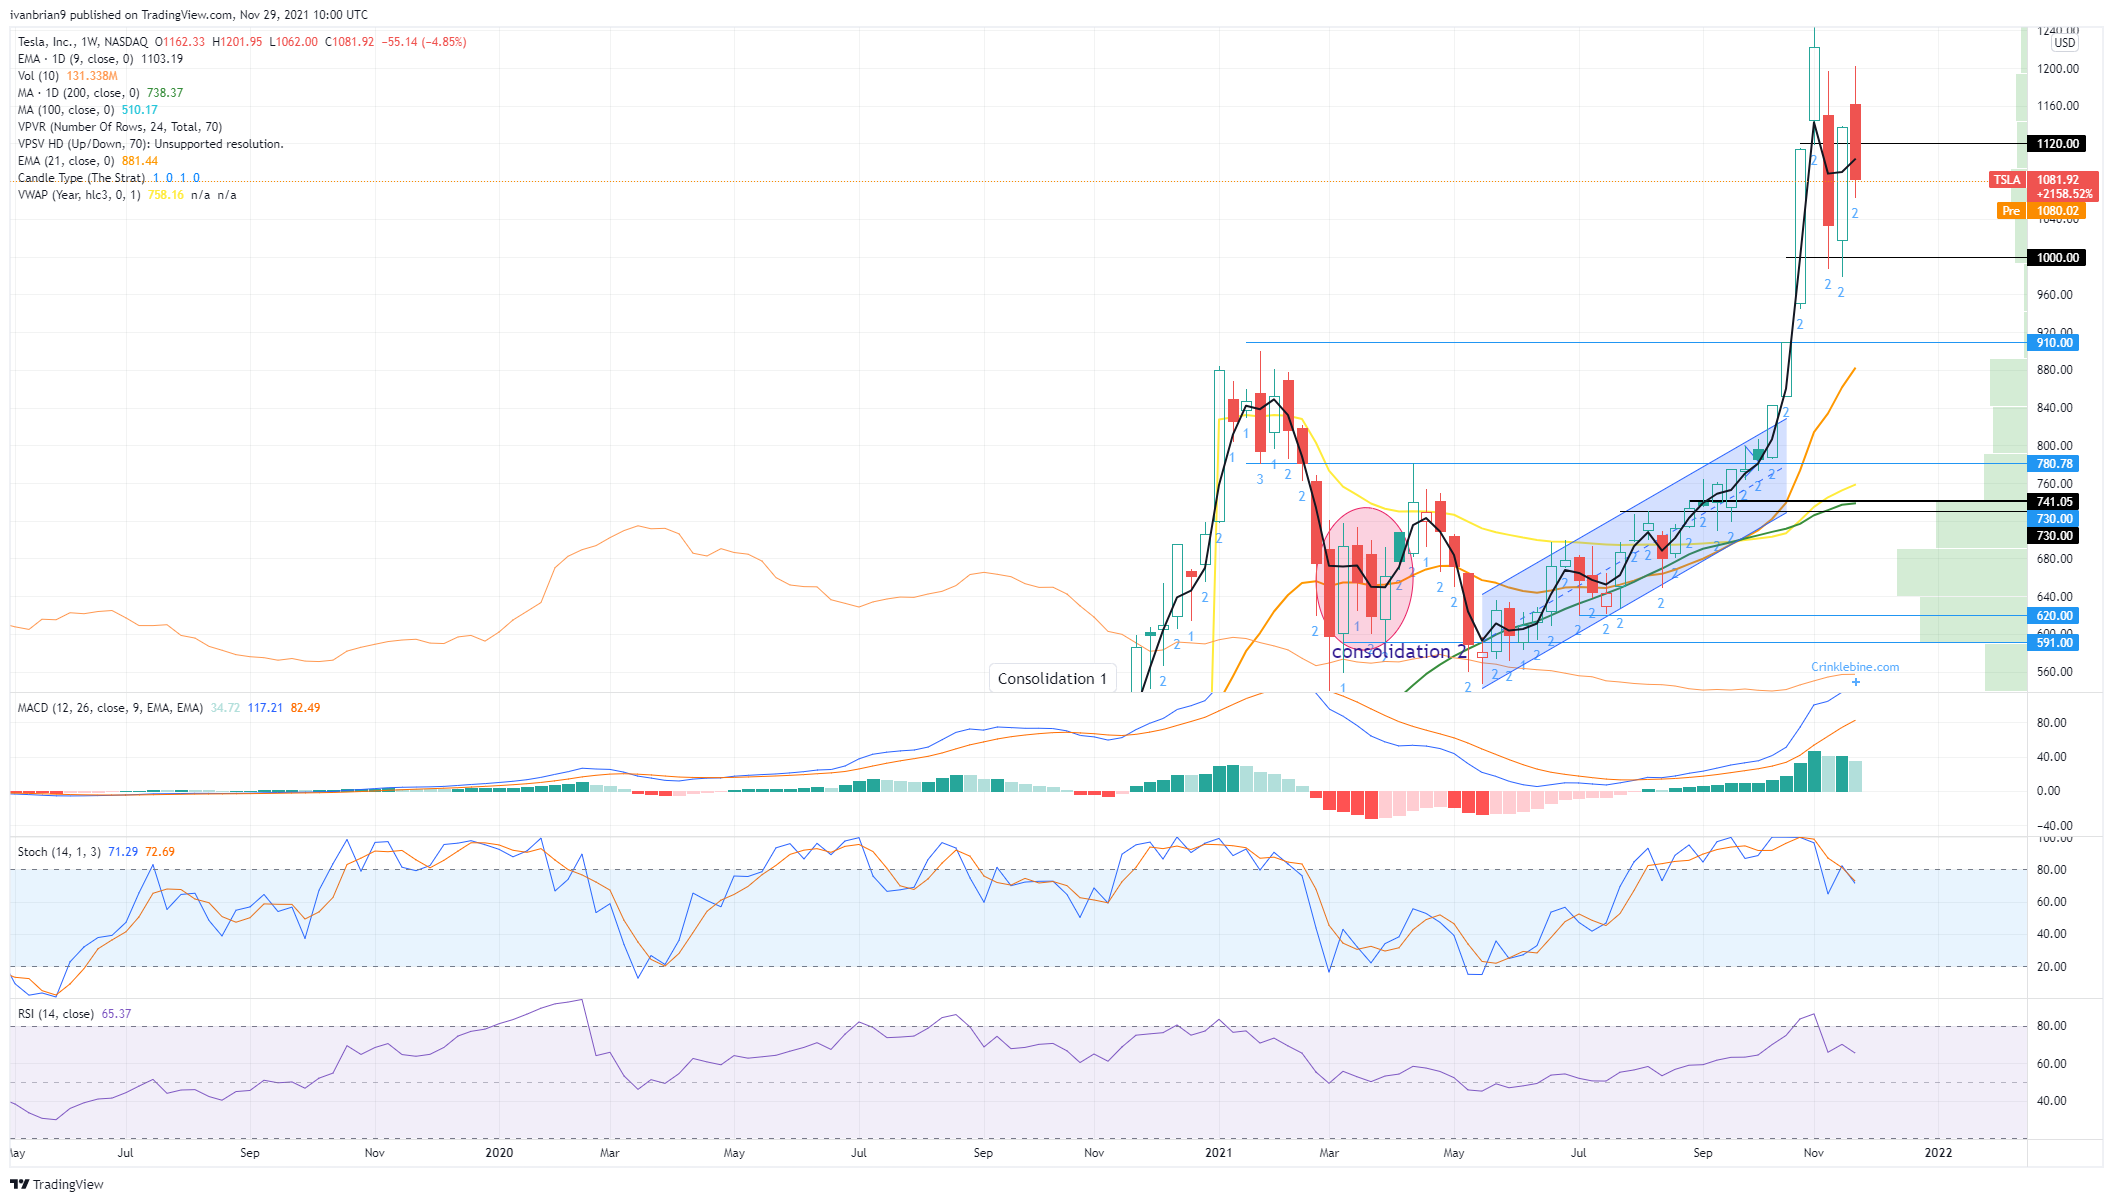
The weekly chart shows us how important it is to hold this $1,000 level. It is the low end of the consolidation after the Hertz-inspired rally. Breaking $1,000 would end that rally and see a move back toward the longer-term range from $780 to $910. So $1,000 is important psychologically and from a trend perspective. We should also point out how accurate the RSI is in the weekly chart at forecasting overbought areas.
The 30-minute chart belwo shows again the strong likelihood of a break below $1,000 accelerating to $910. There is no volume below $1,000 until $900.
Author

Ivan Brian
FXStreet
Ivan Brian started his career with AIB Bank in corporate finance and then worked for seven years at Baxter. He started as a macro analyst before becoming Head of Research and then CFO.


