Tesla Stock News and Forecast: TSLA stock advances in Wednesday's premarket despite Musk's $7 billion sale
- Founder and CEO Elon Musk has sold $6.9 billion in TSLA stock.
- Musk said the sale was to prepare for the possibility he will be forced to buy Twitter.
- Musk offered $43 billion for the social media platform this spring before reneging on the deal.

Elon Musk's sale of $6.9 billion in Tesla (TSLA) stock in preparation of a court forcing him to complete his buyout of Twitter (TWTR) does not seem to be hurting the stock price all that much. In fact, TSLA shares have advanced 2.9% to $874.41 in Wednesday's premarket, more than compensating for Tuesday's 2.4% sell-off to $850.
Tesla stock news
According to regulatory filings, Musk sold 7.92 million shares of Tesla stock on August 5, last Friday. This amounted to approximately $6.9 billion. Musk said the sale was to have cash at the ready in case the Delaware Chancery Court forces him to go through with his takeover of Twitter. Twitter sued Musk after the Tesla CEO walked back his initial buyout offer. Musk has claimed he did so, because Twitter would not supply him with accurate data on the number of bots on the social media platform.
“In the (hopefully unlikely) event that Twitter forces this deal to close *and* some equity partners don’t come through, it is important to avoid an emergency sale of Tesla stock,” Musk wrote.
After accumulating a more than 9% stake in Twitter in the first three months of the year, Musk offered to take it private with a $43.4 billion all-cash offer on April 14. The offer at that time was $54.20 per share, but Musk tried hard to renegotiate the deal after TWTR stock fell to the $30s. Twitter stock is trading up 3.4% in Wednesday's premarket at $44.30, showing that the market remains uncertain whether Musk will be forced to acquire Twitter at the agreed upon price.
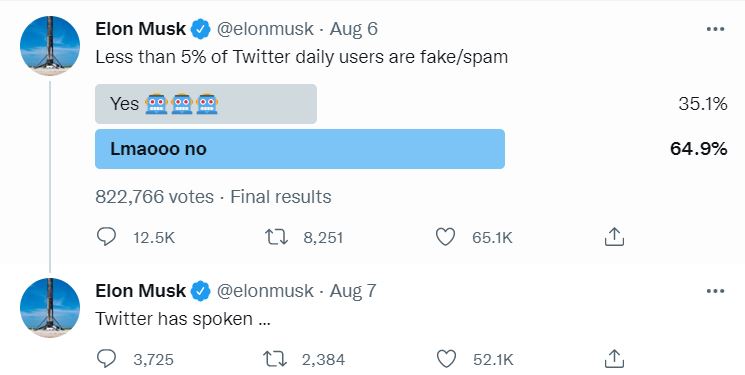
Musk has continued bating Twitter, saying that the platform's stance that less than 5% of its users are bots is a lie. Musk has stated in the past that the figure is closer to 20%. Part of Musk's initial April agreement with Twitter was to pay the company $1 billion if the buyout fails to go through.
Tesla stock forecast
Tesla stock sure looks ready to keep diving despite its premarket activity at the moment. The Moving Average Convergence Divergence (MACD) has reduced its separation from the signal line and appears ready to cross over in a bearish signal.
Last week TSLA stock could not break through the $900 to $955 supply zone that acted as resistance in April and May. From a chart-base perspective, TSLA stock should seek support after a failure at resistance. Unfortunately, the only support of note is at the 21-day moving average near $812. TSLA shares already broke through the 9-day moving average on Friday, August 5. Below there is the $780 level that acts as a pivot point between bullish and bearish trends. Longer-term support remains at $620.
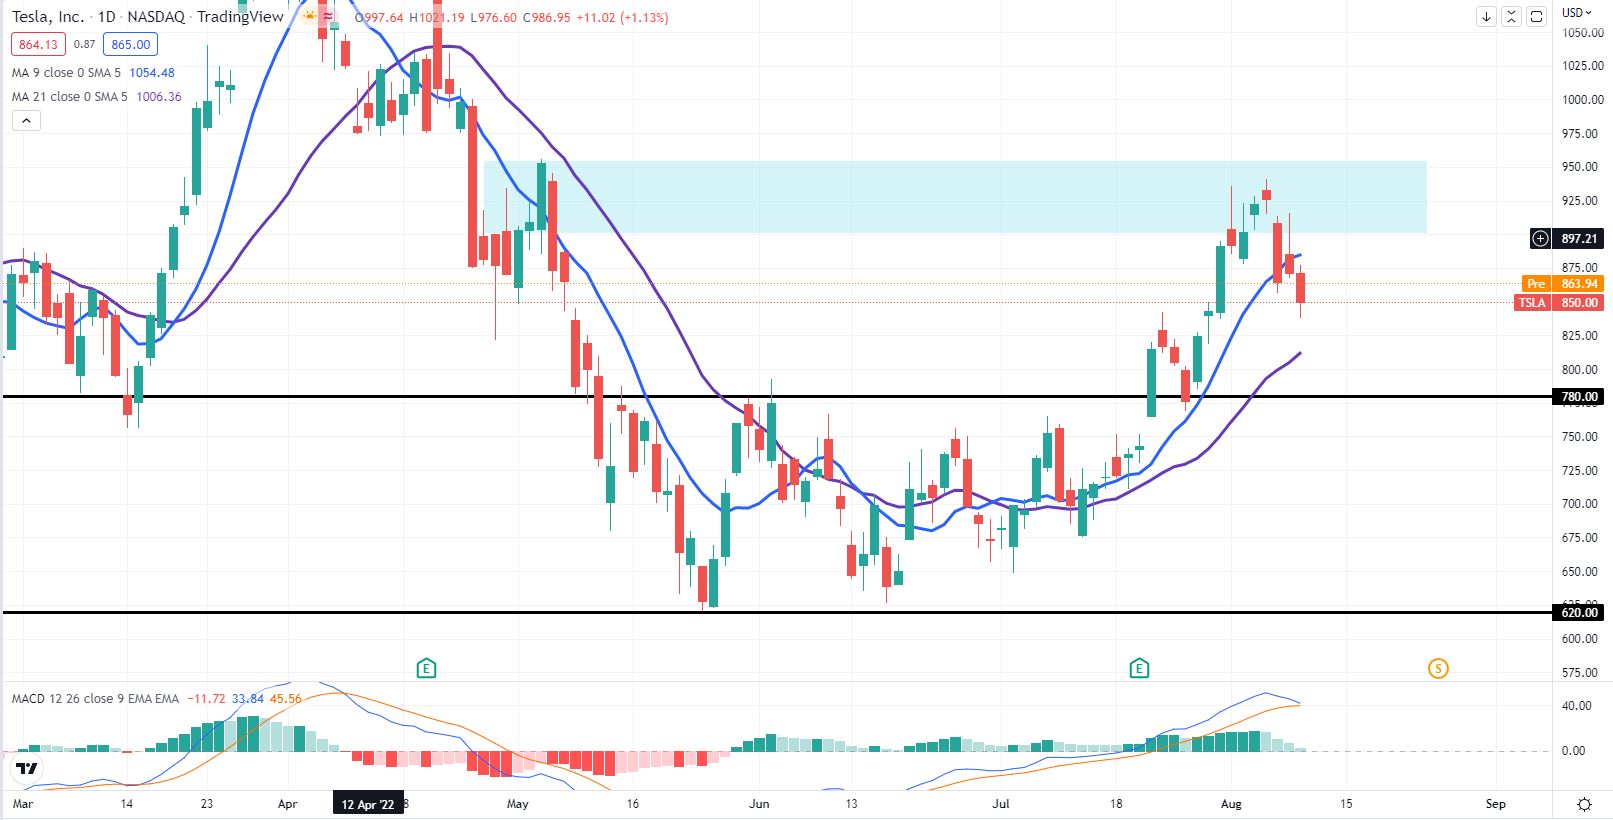
TSLA daily chart
Premium
You have reached your limit of 3 free articles for this month.
Start your subscription and get access to all our original articles.
Author

Clay Webster
FXStreet
Clay Webster grew up in the US outside Buffalo, New York and Lancaster, Pennsylvania. He began investing after college following the 2008 financial crisis.


