SPDR S&P 500 ETF Trust (SPY) Stock News and Forecast: Buy the dip?


  • SPY finally sheds some gains and closes down nearly 1%.
  • SPY was hit by weak retails sales numbers and Delta fears.
  • S&P 500 ETF has now dipped, so is it time to buy?

Do not get too excited, but we may have spotted a dip on the horizon for you to dip into! Dips, any dips, have been eagerly bought up since the pandemic started as equity markets have gone on the greatest bull run in decades. CNBC reported yesterday that the S&P 500 has doubled from the pandemic low, the quickest doubling since World War II. This may be worrying with our friends over at the Market Ear pointing out that 100% returns tend to result in corrections. Some are modest ones, but some others are rather nasty ones. 

100% sure we get a correction after 100% gains?

Source: Refinitiv and themarketear.com

Nobody it seems is overly bullish, but with a backdrop of the Fed and every other central bank pumping and households and corporates awash with cash, we cannot see the party stopping just yet. Earnings season was stellar, and buy-back season is starting. Dips then are there to be bought in our view. The problem is making sure it is just a dip and getting in at the right time.

SPY stock forecast

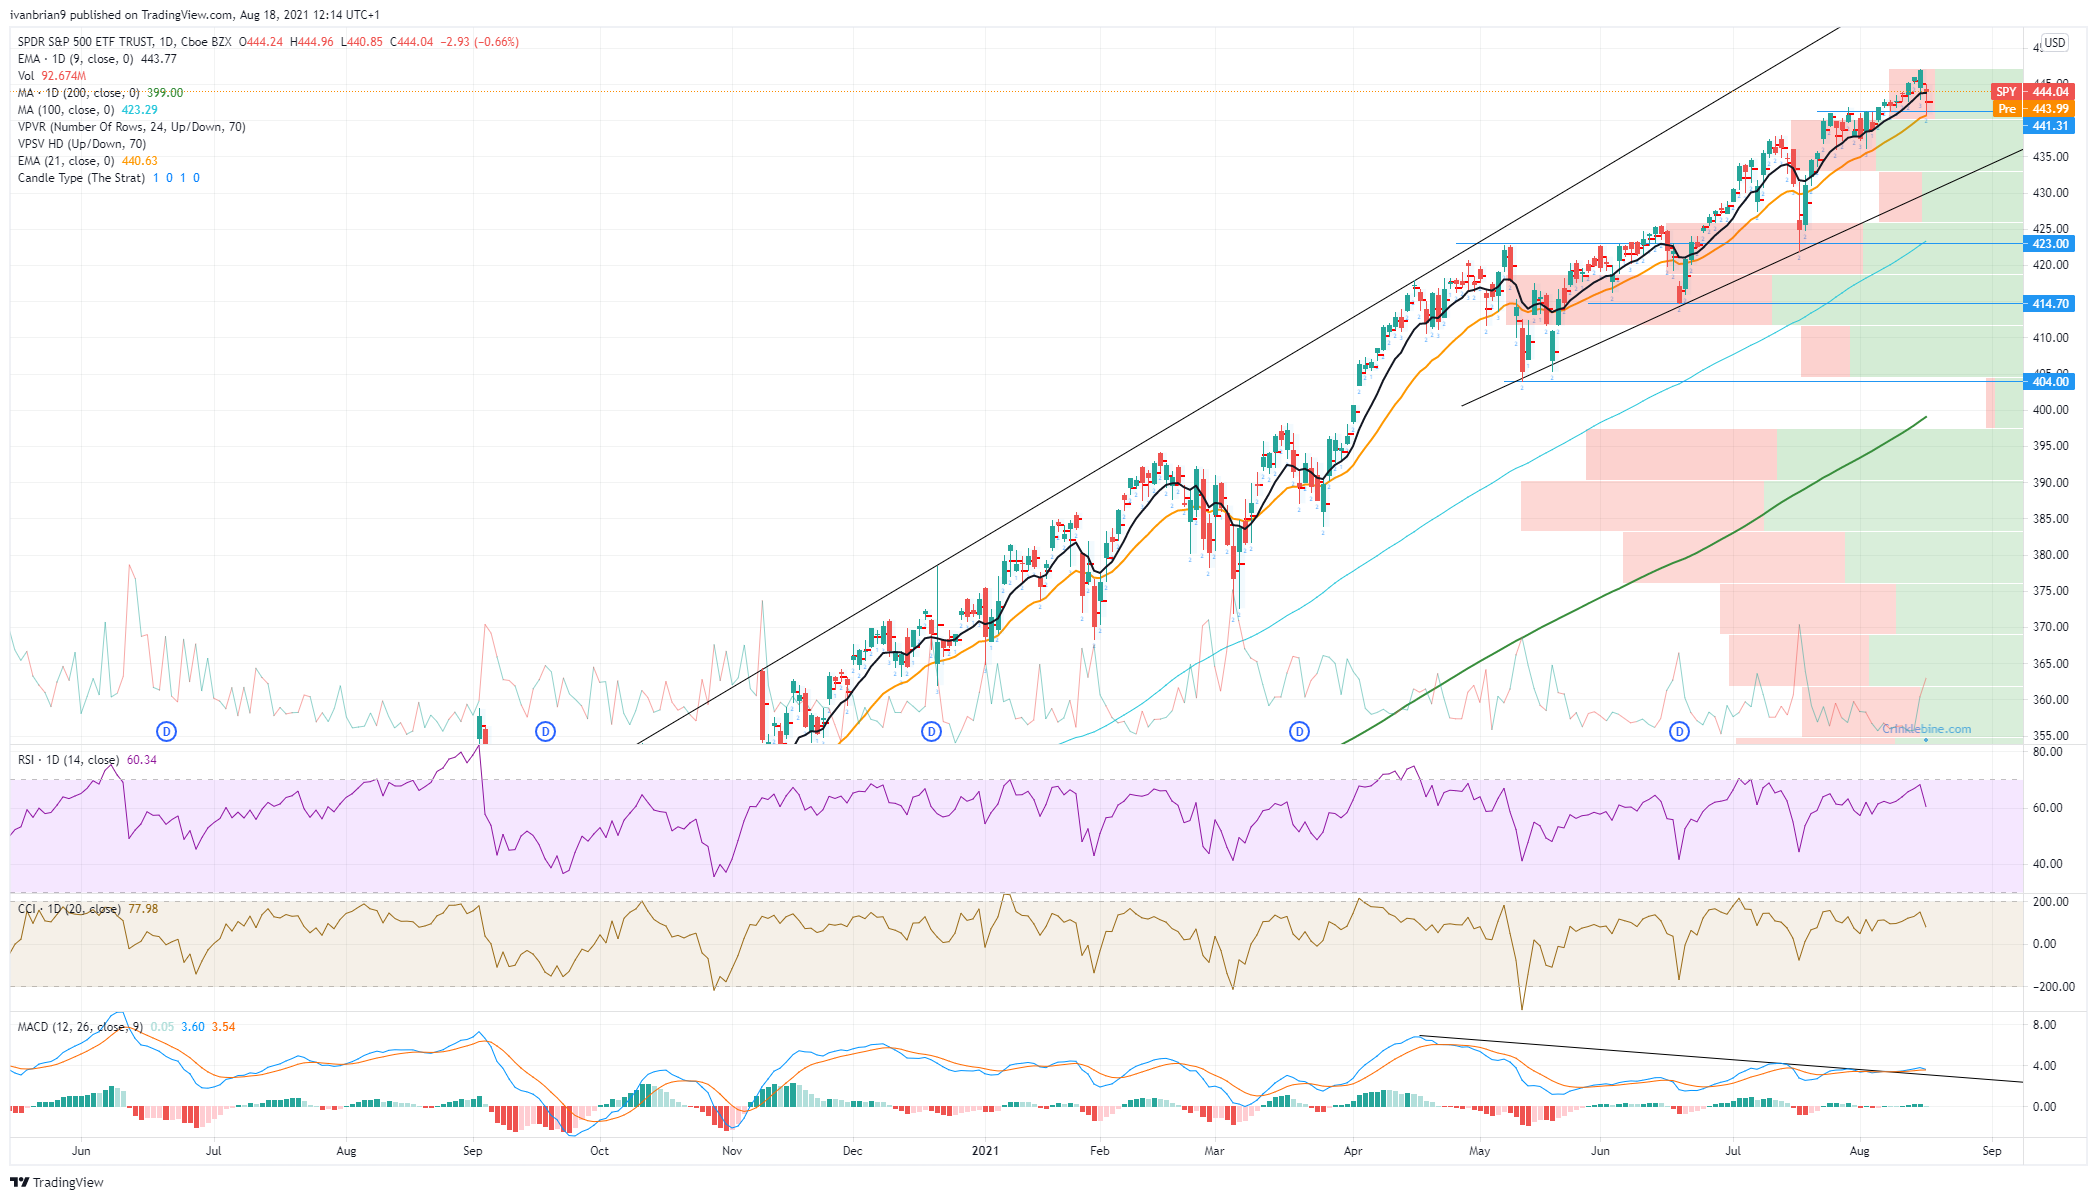
We identified $441.31 yesterday as the first support, and so it was that $440.85 was the low, close but not perfect. Will this support hold? Who knows, but savvy buyers may have stepped in to buy, seeing the volume profile just below and knowing that there should be volume-based support underneath to limit losses and make any slippage on a trailing stop minimal. There is prety decent volume support until $436. If $436 breaks, then it is a waitng game. The trend line will come into play at $430, but we are not too happy with this support level and prefer $423. 

For now the market remains bullish with the classic series of higher highs and lows, but the 9-day moving average has given way. The 21-day has held though and adds to our $441 support level as its sits there. The momentum osciallators are not giving us too much, but the Moving Average Convergence Divergence (MACD) indicators have broken out of the bearish divergence downtrend. 


Like this article? Help us with some feedback by answering this survey:

Share: Feed news

Information on these pages contains forward-looking statements that involve risks and uncertainties. Markets and instruments profiled on this page are for informational purposes only and should not in any way come across as a recommendation to buy or sell in these assets. You should do your own thorough research before making any investment decisions. FXStreet does not in any way guarantee that this information is free from mistakes, errors, or material misstatements. It also does not guarantee that this information is of a timely nature. Investing in Open Markets involves a great deal of risk, including the loss of all or a portion of your investment, as well as emotional distress. All risks, losses and costs associated with investing, including total loss of principal, are your responsibility. The views and opinions expressed in this article are those of the authors and do not necessarily reflect the official policy or position of FXStreet nor its advertisers. The author will not be held responsible for information that is found at the end of links posted on this page.

If not otherwise explicitly mentioned in the body of the article, at the time of writing, the author has no position in any stock mentioned in this article and no business relationship with any company mentioned. The author has not received compensation for writing this article, other than from FXStreet.

FXStreet and the author do not provide personalized recommendations. The author makes no representations as to the accuracy, completeness, or suitability of this information. FXStreet and the author will not be liable for any errors, omissions or any losses, injuries or damages arising from this information and its display or use. Errors and omissions excepted.

The author and FXStreet are not registered investment advisors and nothing in this article is intended to be investment advice.

Recommended content


Recommended content

Editors’ Picks

EUR/USD edges lower toward 1.0700 post-US PCE

EUR/USD edges lower toward 1.0700 post-US PCE

EUR/USD stays under modest bearish pressure but manages to hold above 1.0700 in the American session on Friday. The US Dollar (USD) gathers strength against its rivals after the stronger-than-forecast PCE inflation data, not allowing the pair to gain traction.

EUR/USD News

GBP/USD retreats to 1.2500 on renewed USD strength

GBP/USD retreats to 1.2500 on renewed USD strength

GBP/USD lost its traction and turned negative on the day near 1.2500. Following the stronger-than-expected PCE inflation readings from the US, the USD stays resilient and makes it difficult for the pair to gather recovery momentum.

GBP/USD News

Gold struggles to hold above $2,350 following US inflation

Gold struggles to hold above $2,350 following US inflation

Gold turned south and declined toward $2,340, erasing a large portion of its daily gains, as the USD benefited from PCE inflation data. The benchmark 10-year US yield, however, stays in negative territory and helps XAU/USD limit its losses. 

Gold News

Bitcoin Weekly Forecast: BTC’s next breakout could propel it to $80,000 Premium

Bitcoin Weekly Forecast: BTC’s next breakout could propel it to $80,000

Bitcoin’s recent price consolidation could be nearing its end as technical indicators and on-chain metrics suggest a potential upward breakout. However, this move would not be straightforward and could punish impatient investors. 

Read more

Week ahead – Hawkish risk as Fed and NFP on tap, Eurozone data eyed too

Week ahead – Hawkish risk as Fed and NFP on tap, Eurozone data eyed too

Fed meets on Wednesday as US inflation stays elevated. Will Friday’s jobs report bring relief or more angst for the markets? Eurozone flash GDP and CPI numbers in focus for the Euro.

Read more

Forex MAJORS

Cryptocurrencies

Signatures