SPDR S&P 500 ETF Trust (SPY) News and Forecast: Why is SPY falling?


  • SPY stages the perfect dead cat bounce on Friday.
  • SPY closes a tumultuous week over 1% higher at $434.24.
  • Stocks remain bearish and further losses are in the cards.

Investors will clearly be glad to see the back of last week despite a positive tone on Friday. The market was due a dead cat bounce, and that is exactly what we got with a meek move to end the week and perhaps some shorts taking profits. The overall tone among equity players remains negative, with a host of headwinds lining up to be used as an excuse for the latest losses. As we have mentioned many times here at FXStreet, the narrative will be shaped after the fact to meet the price action. The market will do what it wants to and ignore data or fundamentals many times over. This correction was long overdue and comes as numerous shorts have been squeezed with a slow and steady grind higher for most of the summer. Now that many shorts have given up, it was a perfect time then to actually go short. 

SPY 15 minute

SPY stock forecast

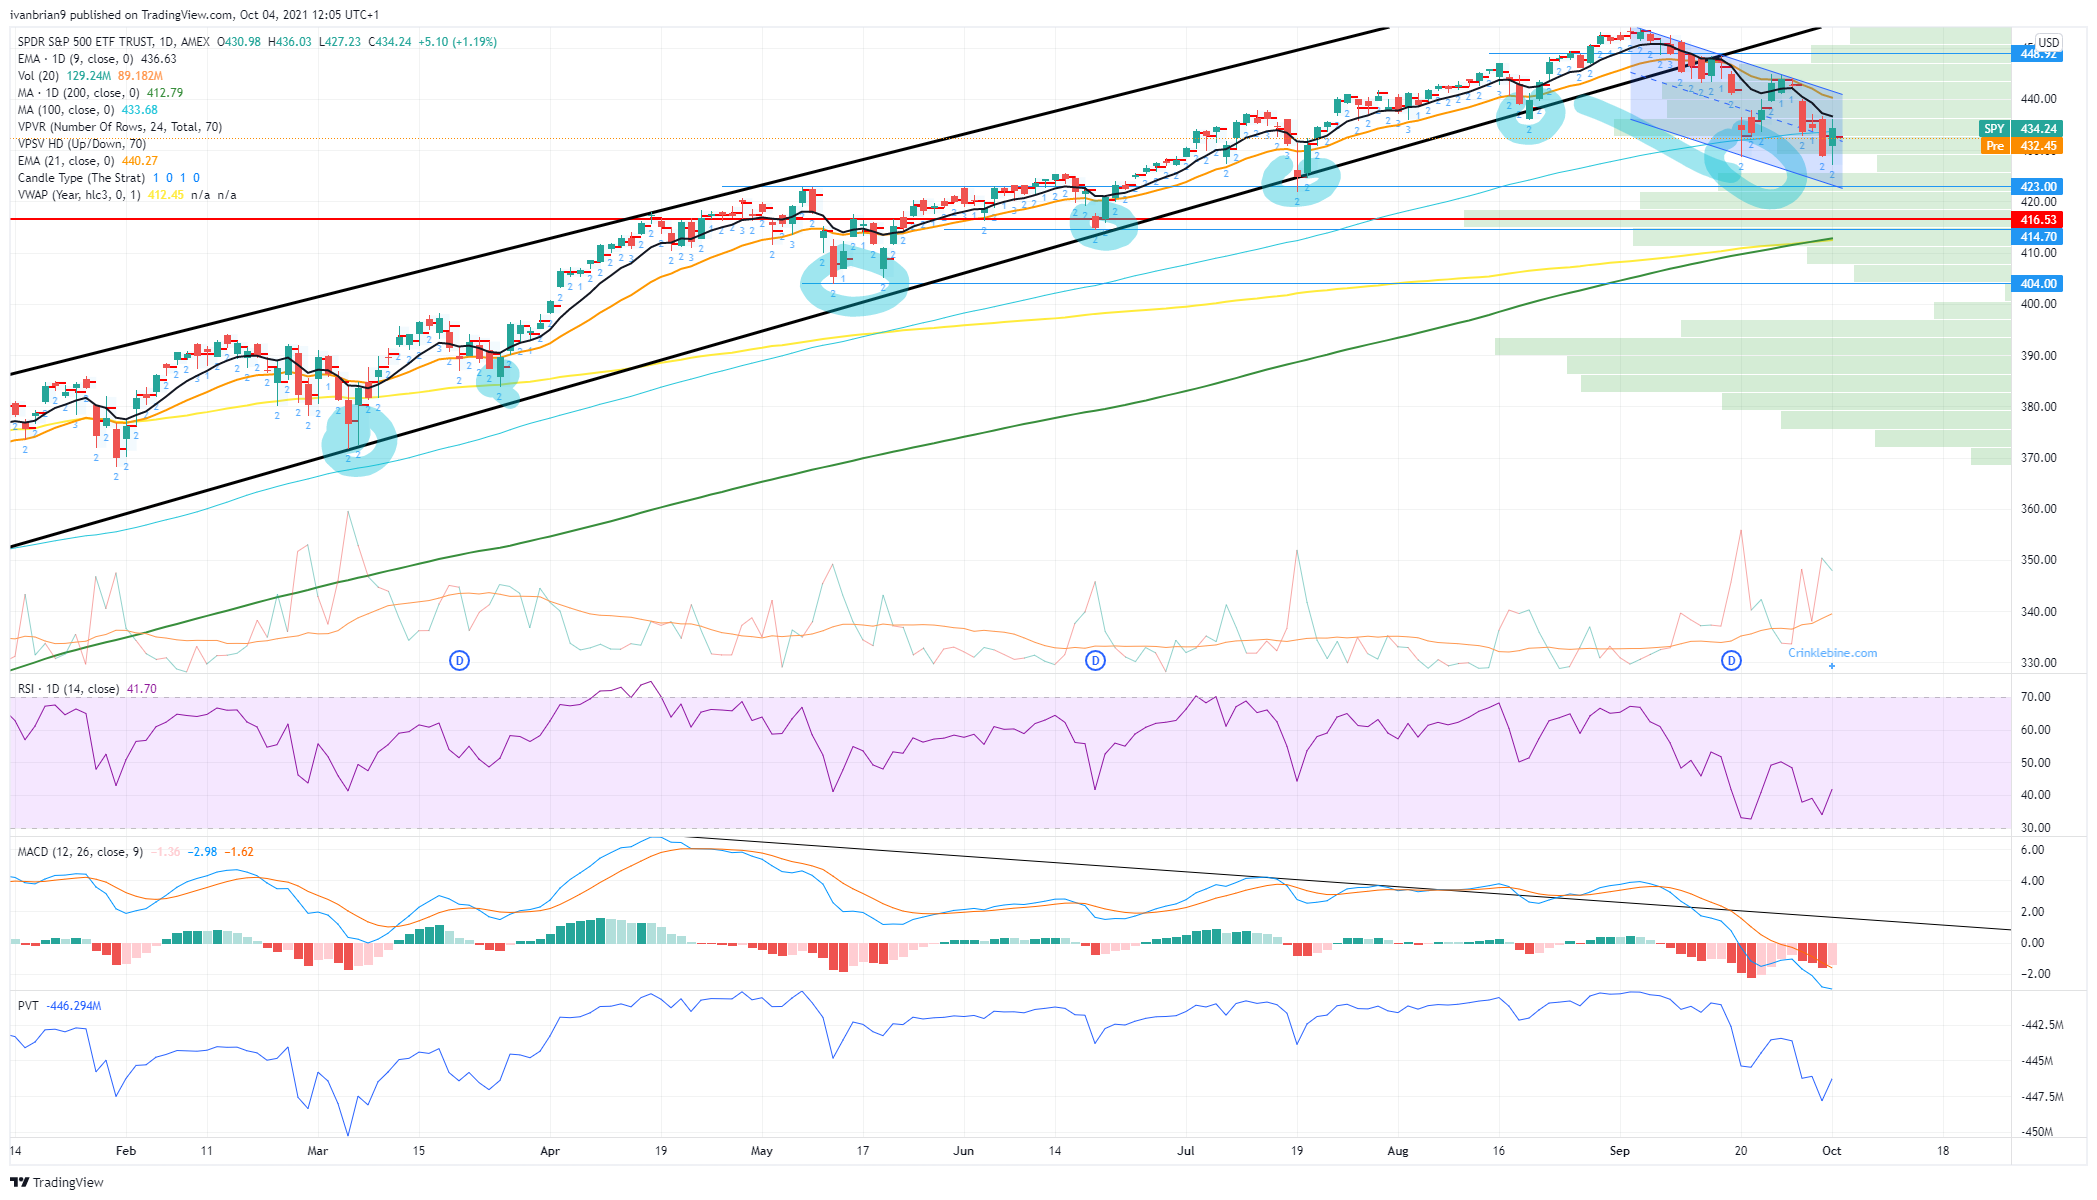
October is a spooky time for investors (ok, bad Halloween pun), but it is the most volatilie month historically for stock market swings. Buckle up and ride it out! September was one of the worst months since the pandemic began, so this could be the start of a new trend, which we have been calling since the lower low back on September 20. The trend channel identified below is intact. The SPY is trading below the 9-day moving average, and the momentum indicators are all trending lower with price. We stick with the bearish call so long as the SPY remains below $443. 

Our call from before the open on Friday worked out nicely, thank you very much: "$434 to $436 is much of the recent volume as we can see the volume profile bars are large here on the 15-minute chart below. This is short-term resistance." Friday's high was $436.03. Sorry, we missed it by 3 cents! We would like to see $427 broken reasonably quickly to avoid the appearance of a double bottom. Also below $428 volume thins out, meaning we would expect a quick move to $415. This is our buy-the-dip zone with a huge volume profile and the yearly Volume Weighted Average Price (VWAP) and 200-day moving average at $413 to $415.


Share: Feed news

Information on these pages contains forward-looking statements that involve risks and uncertainties. Markets and instruments profiled on this page are for informational purposes only and should not in any way come across as a recommendation to buy or sell in these assets. You should do your own thorough research before making any investment decisions. FXStreet does not in any way guarantee that this information is free from mistakes, errors, or material misstatements. It also does not guarantee that this information is of a timely nature. Investing in Open Markets involves a great deal of risk, including the loss of all or a portion of your investment, as well as emotional distress. All risks, losses and costs associated with investing, including total loss of principal, are your responsibility. The views and opinions expressed in this article are those of the authors and do not necessarily reflect the official policy or position of FXStreet nor its advertisers. The author will not be held responsible for information that is found at the end of links posted on this page.

If not otherwise explicitly mentioned in the body of the article, at the time of writing, the author has no position in any stock mentioned in this article and no business relationship with any company mentioned. The author has not received compensation for writing this article, other than from FXStreet.

FXStreet and the author do not provide personalized recommendations. The author makes no representations as to the accuracy, completeness, or suitability of this information. FXStreet and the author will not be liable for any errors, omissions or any losses, injuries or damages arising from this information and its display or use. Errors and omissions excepted.

The author and FXStreet are not registered investment advisors and nothing in this article is intended to be investment advice.

Recommended content


Recommended content

Editors’ Picks

EUR/USD trims gains and returns below 1.0800

EUR/USD trims gains and returns below 1.0800

The sudden data-driven bounce in the Greenback motivated EUR/USD to give away part of the daily gains and refocus on the area below the 1.0800 support on Monday.

EUR/USD News

GBP/USD loses some traction and revisits 1.2550

GBP/USD loses some traction and revisits 1.2550

GBP/USD now sheds some ground in reponse to the marked comeback in the US Dollar after the NY Fed Inflation Expectations came in higher than expected.

GBP/USD News

Gold accelerates its corrective decline to $2,330

Gold accelerates its corrective decline to $2,330

Gold prices remain on the back foot amidst some recovery in the Greenback ahead of the release of US PPI and CPI later in the week, prompting XAU/USD to retest the $2,330 region per troy ounce.

Gold News

Crypto market under pressure from Bitcoin

Crypto market under pressure from Bitcoin

Crypto market cap on Monday stands at $2.2 trillion, down 5.2% over seven days, although it showed some growth over the weekend. Local market capitalisation peaked on March 14th, but the active decline began about a month ago.

Read more

Five fundamentals for the week: Inflation and what the Fed says about it are in focus Premium

Five fundamentals for the week: Inflation and what the Fed says about it are in focus

Will inflation finally fall? That is the question for markets, battered by four consecutive worrying releases of the all-important CPI. A warm-up with PPI, speeches by key Fed officials, and also a look at the central bank's second mandate.

Read more

Forex MAJORS

Cryptocurrencies

Signatures