![]() Barry Weinstein
Barry Weinstein
Volatility Markets Newswire
Introduction
VolatilityMarkets suggests top quant trade ideas to take advantage of trending markets.
Market summary
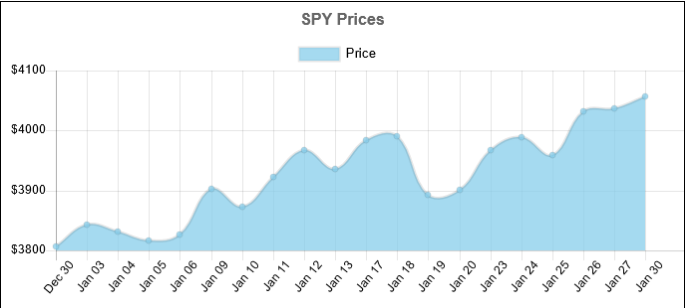
SPY last price was $ 4,056.80. In the short term SP500 has been accelerating higher. In the long term SP500 has been decelerating higher. Over the past 19 days, the SPY price increased 13 days and decreased 6 days. For every up day, there were 0.46 down days. The average return on days where the price increased is 0.9157% The average return on days where the price decreased is -0.902% Over the past 19 Days, the price has increased by 6.58% percent. Over the past 19 days, the average return per day has been 0.3463% percent. With the long term trend being the stronger of the two, we propose a long trade idea with an overnight time horizon.
The trade idea
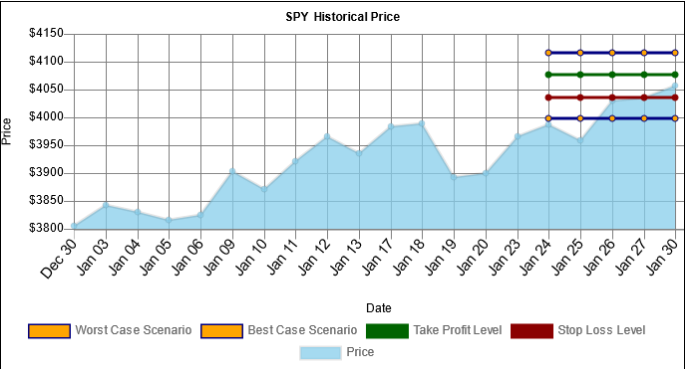
Buy $ 202,330 USD of SP500, take profit at $ 4,076.8678 level with 49.96% odds for a $ 1,000 USD gain, stop out at $ 4,036.7496 with 50.0% odds for a $ 1,000 USD loss through O/N time horizon.
Intraday Predictions

SPY trend analysis
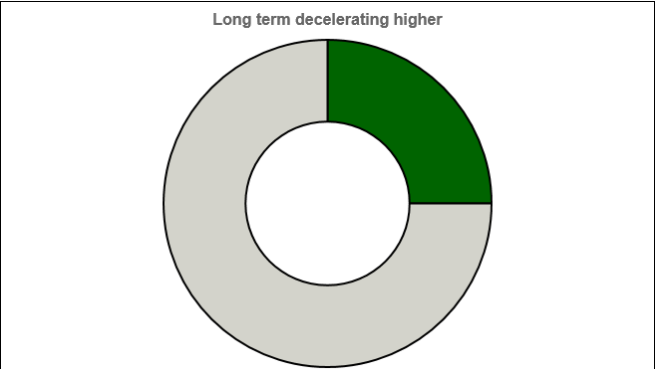
SPY last price was $ 4,056.80. The long term trend decelerating higher is stronger than the short term trend accelerating higher. This trade goes long when the price was moving higher but decelerating over the past 19 days.
SPY value analysis
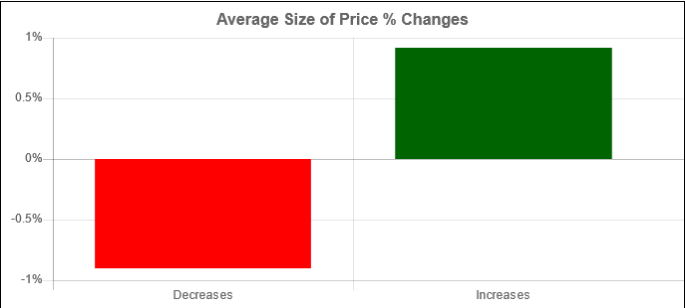
Over the past 19 days, the SPY price increased 13 days and decreased 6 days. For every up day, there were 0.46 down days. The average return on days where the price increased is 0.9157% The average return on days where the price decreased is -0.902% Over the past 19 Days, the price has increased by 6.58% percent. Over the past 19 days, the average return per day has been 0.3463% percent.
SPY worst/best case scenario analysis
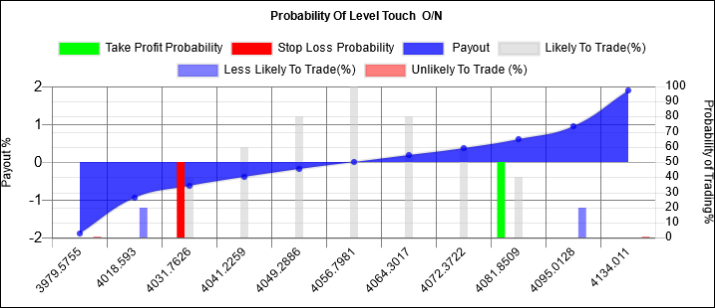
Within 1 week, our worst case scenario where we are 95% certain that this level won't trade for SPY, is $ 3,998.1886, and the best case scenario overnight is $ 4,115.4114. levels outside of this range are unlikely, but still possible, to trade. We are 50% confident that $ 4,036.7496 could trade and that $ 4,076.8678 could trade. These levels are within statistical probability.
Key Takeaways:
-
Price today $ 4,056.80
-
Over the past 19 days, the SPY price increased 13 days and decreased 6 Days.
-
For every up day, there were 0.46 down days.
-
The average return on days where the price increased is 0.9157%.
-
The average return on days where the price decreased is -0.902%.
-
Over the past 19 Days, the price has increased by 6.58% percent.
-
Over the past 19 days, the average return per day has been 0.3463% percent.
-
Over the past 19 days, The price has on average been decelerating: $ -0.9472 per day higher.
-
Over the last session, the price increased by $ 20.25.
-
Over the last session, the price increased by 0.4992 %.
-
Over the last session, the price accelerated by $ 15.00.
Volatility Markets provides trend following trade ideas for momentum traders. The Volatility Markets Newswire measures the direction and acceleration of a security and then structures a trade idea to capitalize on the trend. While trends have been shown to exist in markets over the past 100 years, they are no guarantee of future asset prices. You should take these ideas lightly and at your own risk.
Recommended content
Editors’ Picks
EUR/USD trades with negative bias, holds above 1.0700 as traders await US PCE Price Index

EUR/USD edges lower during the Asian session on Friday and moves away from a two-week high, around the 1.0740 area touched the previous day. Spot prices trade around the 1.0725-1.0720 region and remain at the mercy of the US Dollar price dynamics ahead of the crucial US data.
USD/JPY jumps above 156.00 on BoJ's steady policy

USD/JPY has come under intense buying pressure, surging past 156.00 after the Bank of Japan kept the key rate unchanged but tweaked its policy statement. The BoJ maintained its fiscal year 2024 and 2025 core inflation forecasts, disappointing the Japanese Yen buyers.
Gold price flatlines as traders look to US PCE Price Index for some meaningful impetus

Gold price lacks any firm intraday direction and is influenced by a combination of diverging forces. The weaker US GDP print and a rise in US inflation benefit the metal amid subdued USD demand. Hawkish Fed expectations cap the upside as traders await the release of the US PCE Price Index.
Sei Price Prediction: SEI is in the zone of interest after a 10% leap

Sei price has been in recovery mode for almost ten days now, following a fall of almost 65% beginning in mid-March. While the SEI bulls continue to show strength, the uptrend could prove premature as massive bearish sentiment hovers above the altcoin’s price.
US core PCE inflation set to signal firm price pressures as markets delay Federal Reserve rate cut bets

The core PCE Price Index, which excludes volatile food and energy prices, is seen as the more influential measure of inflation in terms of Fed positioning. The index is forecast to rise 0.3% on a monthly basis in March, matching February’s increase.