S&P 500 SPDR ETF (SPY) Quote and Forecast: What goes up must come down, but when?
- S&P 500 exchange-traded fund (ETF) ticker SPY still bulled up.
- SPY showing some signs of being overstretched.
- SPY is still supported by the Fed loose policy.

Update: SPY is just retracing back to the 9-day moving average which is a key indicator of short-term sentiment. The market remains calm with relatively slow moves but some of the recent big drives are losing momentum. AAPL, AMZN, TSLA GOOGL, TWTR, and NFLX are all down in early trading and that is a fair chunk of market cap right there. The technical chart levels below remain relevant as the SPY flatlines. The amount of companies mentioning raw material pressures during results releases continues to rise as earnigns season progresses, this will be a recurring theme.
The stock market never goes down is the mantra behind 2020 and 2021 and a whole generation of newbie (HOOD) investors are growing up thinking that way. First, we gave everyone a medal for finishing the race, and now it has led to this. The Fed giving medals to everyone who is long. I am sure this ends well! The older and naturally more cynical of us realize that not everything can go up forever, but the shrewder investors know not to fight the Fed. As Tsun Tzu says: if your enemy is stronger, flee. The Fed certainly is stronger, so better just to go with the flow and adopt the mantra "the trend is your friend." Being a contrarian trader is not in vogue at the moment.
-637635861350018946.png)
The chart above clearly shows the outperformance of the Nasdaq since May, with the Russell 2000 (IWM) being the serial underperformer. Now that big tech looks to have turned over though can the IWM lead the way and take over? Certainly, a pairs trade such as long Russell 2000 (IWM) / short Nasdaq EFT (QQQ) has relative valuation merit.
Take a closer look at the SPY to see if it indeed as bearish
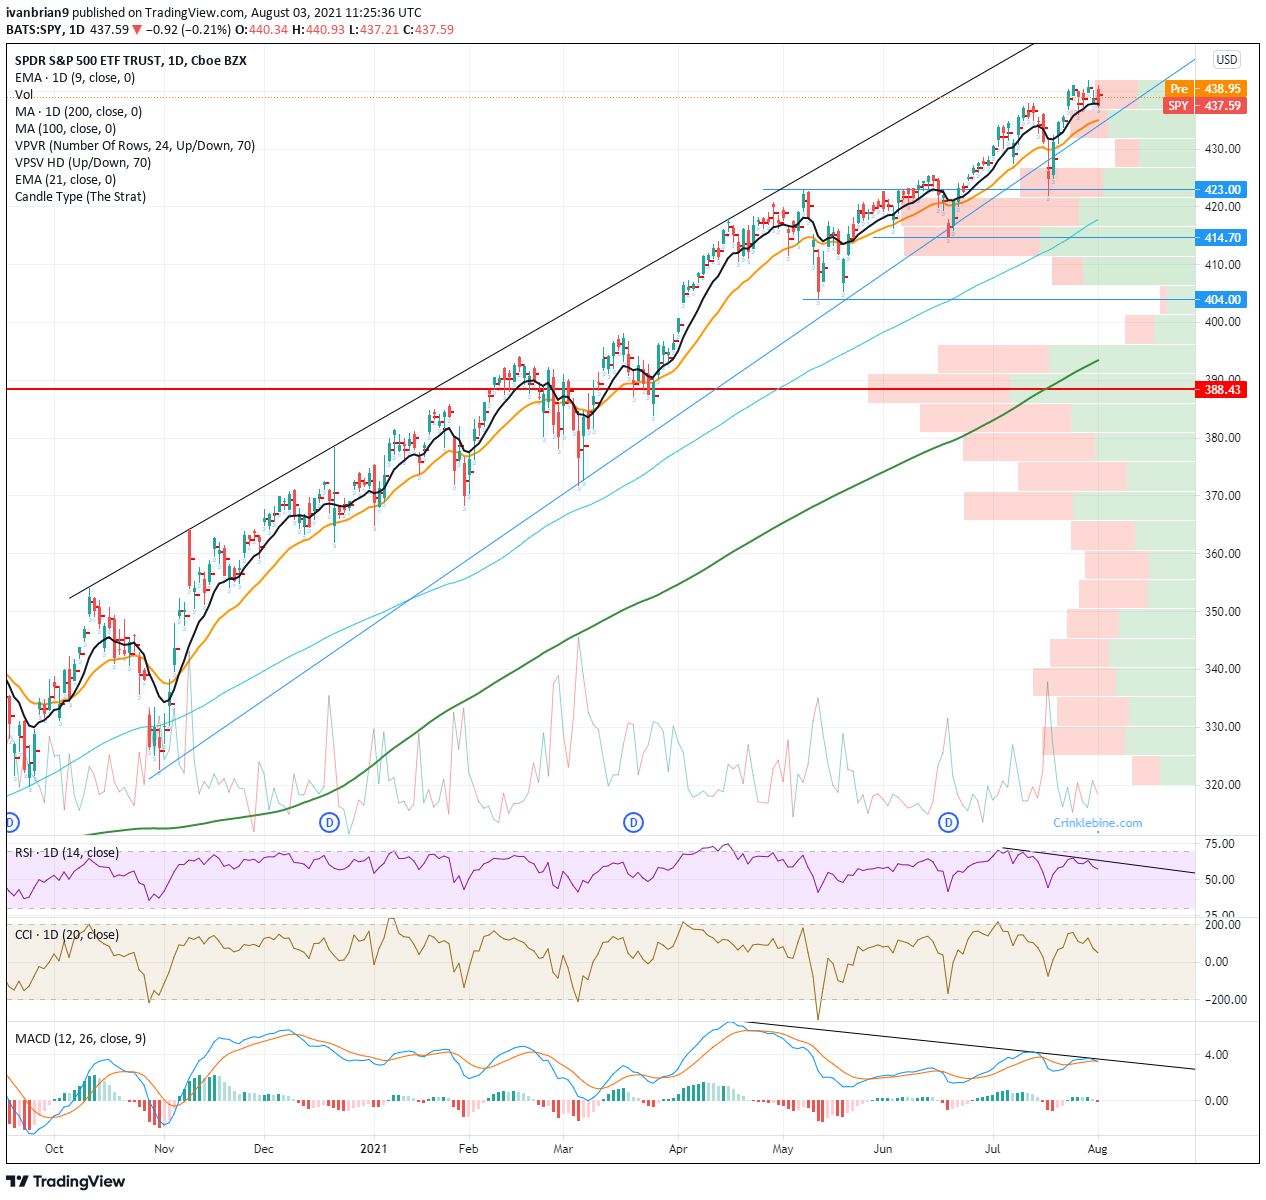
SPY stock forecast
Taking the chart below as a clearly identifiable uptrend, one may notice some key divergences are in play. First, we have a Relative Strength Index (RSI) bearish divergence. The SPY stock has continued to make new highs, but the RSI has not. A similar situation exists in the Moving Average Convergence Divergence (MACD). Here is a bearish divergence of a downtrend, while the SPY stock is in an uptrend. Having two indicators line up like this gives extra credence to the argument. The last dip on July 19 had little volume, so any move lower toward this should see an acceleration due to lack of volume support. Break $433 and it is on for a swift move to $420. This zone from $410 to $420 becomes our buy-the-dip target with strong volume-based support here. $414.70 is the main support – the low from June 18.
Like this article? Help us with some feedback by answering this survey:
Premium
You have reached your limit of 3 free articles for this month.
Start your subscription and get access to all our original articles.
Author

Ivan Brian
FXStreet
Ivan Brian started his career with AIB Bank in corporate finance and then worked for seven years at Baxter. He started as a macro analyst before becoming Head of Research and then CFO.


