S&P 500 (SPX, SPY, ES) technical levels to watch as more record highs broken
- S&P 500 set yet another record high on Thursday.
- US CPI data was not enough to stop the running of the bulls.
- Slow and steady as technicals and fundamentals remain supportive.

US stocks all performed well on Thursday as the US CPI was high but not too high to cause the sell-off that bears had been hoping for. Inflation has moved to multi-year highs, but this has now been well flagged and accepted by market participants. Even the Fed has come to the acceptance that it may have problems with inflation going forward, but it remains committed to ultra-loose monetary policy. With such backstop equities have nothing to do but keep going up. This they duly did on Thursday with the S&P 500 making another new record high.
S&P 500 (SPY, ES, SPX) technical analysis
Traders use one of two means to trace the broad S&P index, the S&P 500 futures (with the E-mini being the most popular) or the SPY Exchange Traded Fund. Both track it almost identically. Using the actual index takes away the ability to use volume indicators, which can be powerful technical analysis tools. Using the futures chart, 4,050 remains as the double bottom from May 12 and 19, which prompted the rally. Volume was low at this level, which led to the price rejection and move higher. This 4,050 area also corresponds to strong support from the trendline in place from the Oct 30 low from last year.
The move is slow and steady as can be witnessed with the divergence from the OnBalance Volume (OBV) indicator. This is a market breadth momentum indicator that basically plots positive days' volume against negative days' volume. A divergence can signal a reversal, so this needs to be watched. Simple market breadth is positive, the number of advancing stocks - declining stocks. Other momentum indicators remain neutral – both the Relative Strength Index (RSI) and Commodity Channel Index (CCI).
The 4,180 was a big level for the S&P 500 futures to get through as can be seen from the volume profile bar on the right of the chart and also the relative balance between bulls and bears in this bar (red and green). Once through here, the index had to push higher. This will serve as a strong support zone on any retracement. A break below 4,050 should see a move through some light volume profile areas to 3,920, the point of control since September 2020 (i.e. the strongest and highest volume, fair value area).

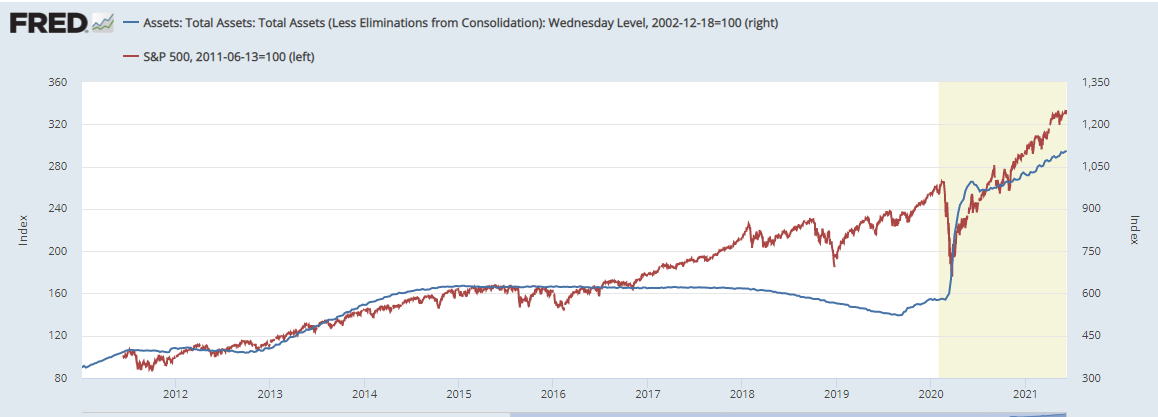
The sentiment and momentum still favours the upside. The Fed's balance sheet has been nicely correlated with equites since 2008 basically and the start of ultra-loose monetary policy. A new record was set again in the most recent data, and the S&P took the lead and made new record highs on Thursday.
Author

Ivan Brian
FXStreet
Ivan Brian started his career with AIB Bank in corporate finance and then worked for seven years at Baxter. He started as a macro analyst before becoming Head of Research and then CFO.


