S&P 500 Forecast: Index closes down slightly on low-volatility Monday ahead of CPI
- Standard & Poor’s 500 index gained 1.31% last week.
- S&P 500 index made new range high last Friday, ending three-month downtrend.
- Big data week ahead with October CPI, PPI inflation, Housing Starts, Retail Sales.
- Lower headline inflation expected to hoist equity prices this week, extending current rally.
- Taiwan Semiconductor, Walmart, Cisco, Target, Home Depot, Alibaba report earnings this week.

The S&P 500 index closed down 0.08% on Monday in a session that was marked by subdued interest from traders. The Dow Jones index closed up 0.16%, while the NASDAQ Composite lost 0.22%.
Despite Monday’s pullback, the week looks bright for investors after the index broke to a new higher high last Friday. This event officially ends the three-month downtrend that began at the end of July on a technical basis.
The index should hinge this week on a wide swath of earnings releases and economic indicators that are scheduled for delivery. First and foremost will be Tuesday’s US Consumer Price Index (CPI) for October. Economists expect headline inflation to recede from September’s figures.
The Producer Price Index (PPI) follows on Wednesday, providing a view of corporate inflation, and US Retails Sales should also give the market an idea of how healthy the American consumer is heading into the big-spending holiday season.
The Home Depot (HD), Target (TGT) and Walmart (WMT) earnings results this week should offer the market an even better peek at the strength of consumer spending and how these nationwide chain stores are dealing with higher supplier prices.
Later in the week, the US Congress’ failure to pass a new spending bill could lead to a federal government shutdown, but the US House of Representatives is set to vote on a continuing resolution early in the week. The market is largely sanguine at the moment that an agreement will be made before the deadline, which comes as soon as Friday.
S&P 500 News: Earnings to focus on retail, China and tech
Tyson Foods (TSN) started the week on a high note for the S&P 500 by releasing a profit beat before the opening bell. The beaten-down food giant reported fiscal fourth-quarter adjusted earnings per share (EPS) of $0.37 on $13.35 billion in sales. Like so many companies this quarter, Tyson beat consensus for earnings but missed on the sales expectation. Tyson beat Wall Street earnings consensus by 12 cents but missed the revenue consensus by nearly $400 million.
The Home Depot is the big kahuna on Tuesday. The DIY home improvement box store is expected to deliver a downturn in results from a year ago as middle-income customers see their covid-era savings dissolve. Analysts are mixed on the third quarter, but the consensus is for $3.76 in GAAP EPS on the back of $37.6 billion in sales. A year ago, The Home Depot reported $4.24 in EPS on $38.87 billion in revenue.
Target and Walmart quarterly results follow The Home Depot on Wednesday and Thursday. Wall Street analysts put the consensus for Target a tad lower from a year ago and have unanimously reduced their earnings forecasts for the quarter. Still, they expect $1.48 in GAAP EPS on $25.2 billion in revenue.
Walmart is forecast to earn $1.51 in GAAP EPS on $158.5 billion in sales. Unlike these other retailers in the week’s cohort, sales are projected to rise $7 billion above last year’s result.
China makes a major showing this week with Alibaba (BABA), JD.com (JD) and XPeng (XPEV) on the docket. On Wednesday, JD.com is expected to earn $0.81 in adjusted EPS on just under $34 billion in sales for the ecommerce firm. Electric vehicle (EV) upstart XPeng is projected to lose $-0.46 in adjusted EPS on $1.18 billion in sales as the Chinese economy deals with a broad downturn and general malaise, especially in the EV space where BYD (BYDDY) and Tesla (TSLA) already dominate and have reduced prices.
Alibaba reports on Thursday, and analysts think the Chinese tech and ecommerce conglomerate will upload a YoY increase on the top and bottom lines but a pullback from the most recent quarter’s results. US investors may put much of their hopes in Alibaba’s cloud segment, but consensus still has Alibaba earning $2.07 in adjusted EPS on revenue of $30.8 billion.
Tower Semiconductor (TSEM), Cisco (CSCO), Sea Limited (SE) and Applied Materials (AMAT) earnings round out the week in the tech and digital space.
Headline inflation expected to fall alongside consumer spending
The October CPI is absolutely the most-watched event of the week on the economic data side of things. It gets released at 13:30 GMT on Tuesday. Economists are forecasting what stock market traders want to hear – a major decline in headline consumer inflation. Consensus has the annual figure arriving at 3.3% and the monthly figure rising 0.1%. This compares to 3.7% and 0.4%, respectively, for September’s release.
The more important core CPI figures are slated to remain unchanged, however, at 0.3% monthly and 4.1% annually. A lower reading on either the core or headline inflation figures should lead to higher stock market prices, while a higher reading will have the opposite, negative effect as the market will assume that the Federal Reserve might hike interest rates higher to combat inflation.
A mixed bag on the CPI will force the market to wait on Wednesday’s PPI release, which also has consensus for the core annualized reading of 2.7% exactly in line with the previous month’s print.
The bad news for retail and other consumer stocks is that the general forecast for October’s US Retail Sales – arriving simultaneously with the PPI data at 13:30 GMT on Wednesday – is for a MoM decline of 0.3%. This comes after September’s monthly 0.7% gain and several months in a row of readings that were positive.
Likewise, both US Housing Starts and Building Permits data for October, released on Friday, are expected to show a monthly decline compared with September.
Dow Jones FAQs
What is the Dow Jones?
The Dow Jones Industrial Average, one of the oldest stock market indices in the world, is compiled of the 30 most traded stocks in the US. The index is price-weighted rather than weighted by capitalization. It is calculated by summing the prices of the constituent stocks and dividing them by a factor, currently 0.152. The index was founded by Charles Dow, who also founded the Wall Street Journal. In later years it has been criticized for not being broadly representative enough because it only tracks 30 conglomerates, unlike broader indices such as the S&P 500.
What factors impact the Dow Jones Industrial Average?
Many different factors drive the Dow Jones Industrial Average (DJIA). The aggregate performance of the component companies revealed in quarterly company earnings reports is the main one. US and global macroeconomic data also contributes as it impacts on investor sentiment. The level of interest rates, set by the Federal Reserve (Fed), also influences the DJIA as it affects the cost of credit, on which many corporations are heavily reliant. Therefore, inflation can be a major driver as well as other metrics which impact the Fed decisions.
What is Dow Theory?
Dow Theory is a method for identifying the primary trend of the stock market developed by Charles Dow. A key step is to compare the direction of the Dow Jones Industrial Average (DJIA) and the Dow Jones Transportation Average (DJTA) and only follow trends where both are moving in the same direction. Volume is a confirmatory criteria. The theory uses elements of peak and trough analysis. Dow’s theory posits three trend phases: accumulation, when smart money starts buying or selling; public participation, when the wider public joins in; and distribution, when the smart money exits.
How can I trade the DJIA?
There are a number of ways to trade the DJIA. One is to use ETFs which allow investors to trade the DJIA as a single security, rather than having to buy shares in all 30 constituent companies. A leading example is the SPDR Dow Jones Industrial Average ETF (DIA). DJIA futures contracts enable traders to speculate on the future value of the index and Options provide the right, but not the obligation, to buy or sell the index at a predetermined price in the future. Mutual funds enable investors to buy a share of a diversified portfolio of DJIA stocks thus providing exposure to the overall index.
Earnings of the week
Earnings spotlight: Monday, November 13 - Tyson Foods (TSN), Tower Semiconductor (TSEM)
Tuesday, November 14 - Home Depot (HD), Sea Limited (SE), On Holding AG (ONON)
Wednesday, November 15 - Cisco (CSCO), TJX Companies (TJX), Palo Alto Networks (PANW), Target (TGT), JD.com (JD), XPeng (XPEV)
Thursday, November 16 - Walmart (WMT), Alibaba (BABA), Applied Materials (AMAT)
Friday, November 17 - BJ's Wholesale Club Holdings (BJ)
What they said about the market – Albert Edwards
Albert Edwards, a strategist for Societe Generale, says that both the bond and equity markets are taking aim at companies with weak balance sheets. Edwards says that junk bond indices are underperforming for this very reason. Data he points to shows that bankruptcies have more than doubled from a year ago. Edwards adds that the S&P 500’s advance in 2023 entirely owes its gains to the Magnificent Seven stocks that run Silicon Valley.
“This is just the tip of a huge corporate zombie iceberg now being exposed - with smaller companies most vulnerable.”
S&P 500 forecast
Last week’s bull target has been taken out. As we wrote one week ago, “This week it is all about the 4,393 resistance point for the S&P 500. Breaking above that high from October 17 will set the precedent of the first higher high in three months.”
This means the drought is finally over after a poor outing in August, September and October. Last Friday, November 10, the S&P 500 index closed at 4,415. Now bulls have their sights set on the lower high from September 1 at 4,541.
With the 9-day Simple Moving Average (SMA) crossing above the 21-day SMA near 4,280, it sure seems that the technical chart is telling us that this rally has much more room to run. This is especially true since a number of economic observers are delivering more sober news of a soft landing that should see the economy move sideways over the next six months, and stock market traders seem to be ignoring the warnings entirely.
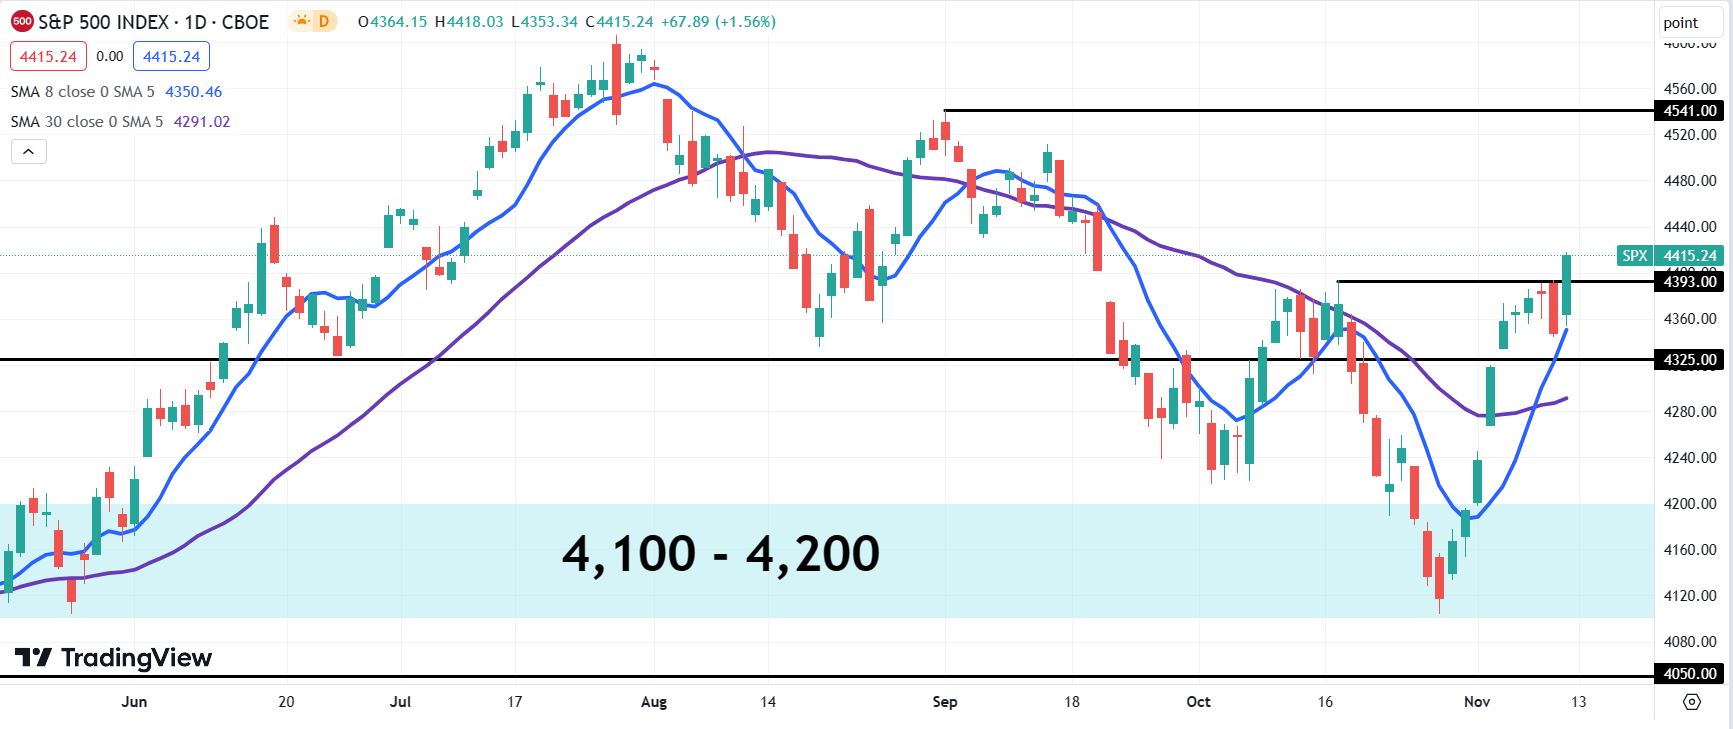
S&P 500 daily chart
Premium
You have reached your limit of 3 free articles for this month.
Start your subscription and get access to all our original articles.
Author

Clay Webster
FXStreet
Clay Webster grew up in the US outside Buffalo, New York and Lancaster, Pennsylvania. He began investing after college following the 2008 financial crisis.


