- Silver price drops from $26.80 as US Dollar, bond yields rebound ahead of US Employment data.
- The US Employment data will influence speculation for Fed rate cuts in June.
- The Fed is still confident of rate cuts this year despite progress in disinflation has stalled.
Silver price (XAG/USD) falls back sharply to $26.20 while attempting to recapture the crucial resistance of $27.00 during the European session on Thursday. The white metal faces pressure as the US Dollar and bond yields attempt to recover amid uncertainty ahead of the United States Nonfarm Payrolls (NFP) and the ISM Services PMI data for April, which will be published on Friday.
The US NFP data would significantly influence market expectations for Federal Reserve (Fed) rate cuts from the June meeting. Economists have anticipated that US employers recruited 243K jobs, lower than 303K additions registered in March. The Unemployment Rate is forecasted to have remained steady at 3.8%.
Investors will keenly focus on the US Average Hourly Earnings data. The annual Average Hourly Earnings are expected to have grown at a slower pace of 4.0% from 4.1% in March, with steady 0.3% growth on a month-on-month basis. Average Hourly Earnings are a leading indicator of wage growth, which indicates the current status of households’ spending and eventually influences price pressures.
The US Dollar Index (DXY) rebounds to 105.75 and 10-year US Treasury yields edge up to 4.61. The US Dollar and bond yields tumbled on Wednesday after less hawkish interest rate guidance from the Federal Reserve (Fed) than feared. The Fed remains optimistic over eventual rate cuts this year despite risks of a slowdown in the disinflation process.
Silver technical analysis
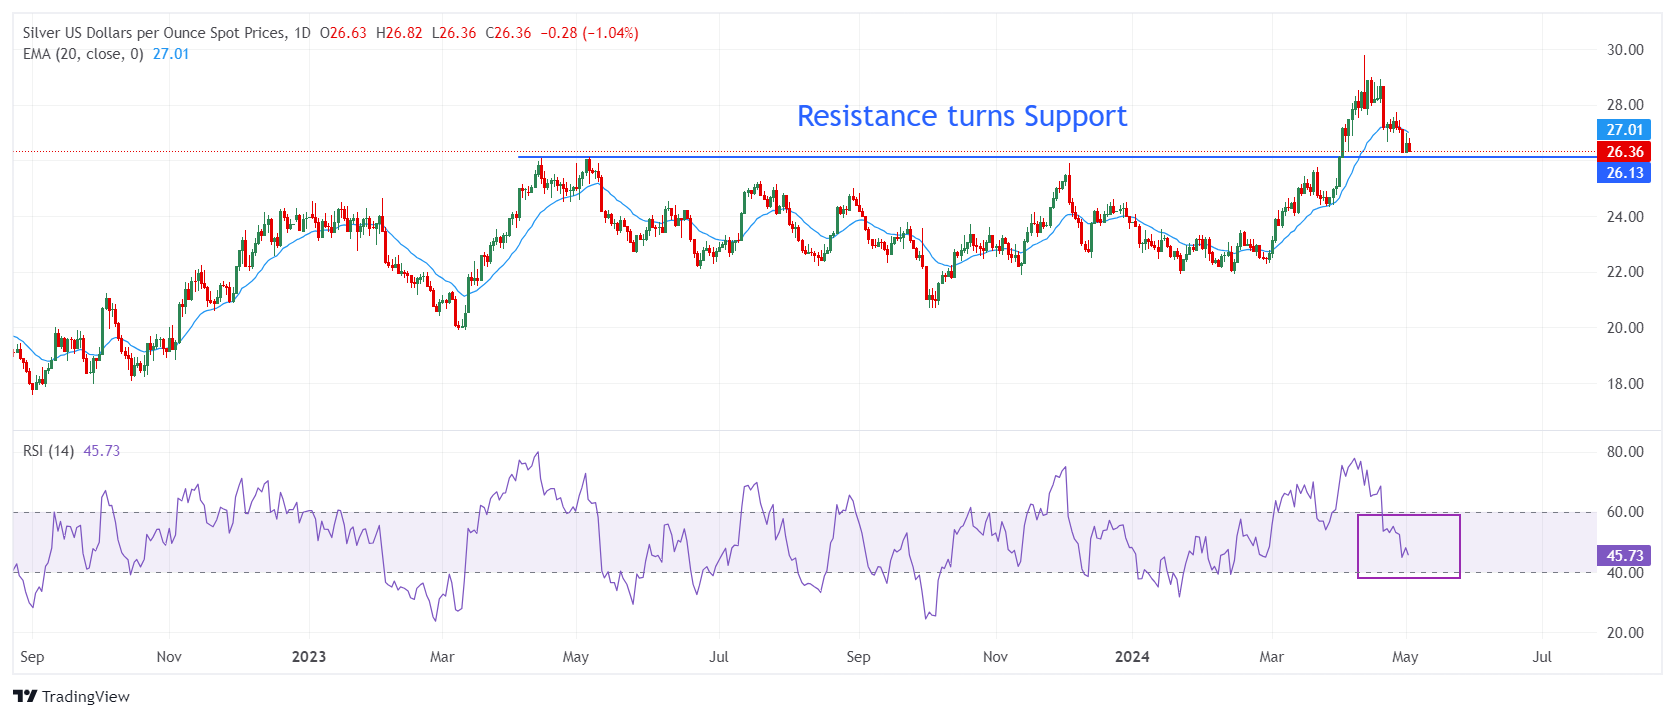
Silver price declines to near the horizontal support plotted from 14 April 2023 high around $26.09 on a daily timeframe. The above-mentioned support was earlier a major resistance for the Silver price bulls. The uncertainty over Silver’s near-term outlook deepens as it has slipped below the 20-period Exponential Moving Average (EMA), which trades around $27.20.
The 14-period Relative Strength Index (RSI) slips into the 40.00-60.00 range, suggesting that the bullish momentum has faded. However, the long-term outlook is still stable.
Silver daily chart
Information on these pages contains forward-looking statements that involve risks and uncertainties. Markets and instruments profiled on this page are for informational purposes only and should not in any way come across as a recommendation to buy or sell in these assets. You should do your own thorough research before making any investment decisions. FXStreet does not in any way guarantee that this information is free from mistakes, errors, or material misstatements. It also does not guarantee that this information is of a timely nature. Investing in Open Markets involves a great deal of risk, including the loss of all or a portion of your investment, as well as emotional distress. All risks, losses and costs associated with investing, including total loss of principal, are your responsibility. The views and opinions expressed in this article are those of the authors and do not necessarily reflect the official policy or position of FXStreet nor its advertisers. The author will not be held responsible for information that is found at the end of links posted on this page.
If not otherwise explicitly mentioned in the body of the article, at the time of writing, the author has no position in any stock mentioned in this article and no business relationship with any company mentioned. The author has not received compensation for writing this article, other than from FXStreet.
FXStreet and the author do not provide personalized recommendations. The author makes no representations as to the accuracy, completeness, or suitability of this information. FXStreet and the author will not be liable for any errors, omissions or any losses, injuries or damages arising from this information and its display or use. Errors and omissions excepted.
The author and FXStreet are not registered investment advisors and nothing in this article is intended to be investment advice.
Recommended content
Editors’ Picks
AUD/USD depreciates amid mixed Chinese data, stronger US Dollar
The AUD/USD continues to decline for the second consecutive session, trading around 0.6660. This is largely influenced by recent mixed economic data from China released on Friday. The Aussie dollar had already been under pressure after Australia's employment figures were released on Thursday, which presented a mixed picture.
EUR/USD slipped on Thursday after Greenback pares some losses
EUR/USD eased slightly on Thursday, falling back below 1.0880 as the Greenback broadly recovers losses from earlier in the week. The pair remains up for the trading week, but a late break for the US Dollar is on the cards as investors second-guess the Fed's stance on rate cuts.
Gold price loses momentum, with Fed speakers in focus
Gold price trades with a bearish bias on Friday after retreating from the nearly $2,400 barrier. The bullish move of precious metals in the previous sessions was bolstered by the softer-than-expected US inflation data in April, which triggered hope for rate cuts from the US Federal Reserve.
LINK price jumps 10% as Chainlink races toward tokenization of funds
Chainlink price has remained range-bound for a while, stuck between the $16.00 roadblock to the upside and $13.08 to the downside. However, in light of recent revelations, the token may have further upside potential.
April CPI: Worst good news ever
The monthly rise in prices based on the Consumer Price Index (CPI) came in slightly lower than projected, sending a wave of euphoria across the financial landscape. The consensus is cooling inflation puts Federal Reserve interest rate cuts back on the table.