|

Silver Price Forecast: XAG/USD advances steadily, eyeing the $20.00 figure

  • XAG/USD climbed on a risk-on impulse and lowered US T-bond yields.
  • US PPI for August tempered inflationary pressures on the producer side.
  • XAG/USD Price Analysis: Break above $20.00 to send silver towards $21.00 mark.

Silver price rebounds at around the 50-day EMA and climbs towards a daily high near $19.69 on Wednesday after the US Labor Department revealed that August PPI was aligned with expectations easing inflationary pressures on the producer side, contrarily to Tuesday’s CPI.

Therefore, the XAG/USD is trading at $19.61, above its opening price by 1.86%.

Before Wall Street opened, US data revealed by the Bureau of Labour Statistics (BLS) showed that the PPI  for August shrank by 0.1%, aligned with the consensus, while the year-over-year figure was down at 8.7%, less than July’s 9.8% report. Meanwhile, the so-called core PPI, which excludes volatile items, edged higher, 0.4% MoM, but on an annual reading, edged up by 7.3%.

In the meantime, the US Dollar Index, a measure of the buck’s value against a basket of six currencies, finished Wednesday’s session down by 0.15%, at 109.648, undermined by US Treasury yields, mainly the 10-year benchmark note rate, unmoved during the day at around 3.404%.

The reflection of the abovementioned is the US Dollar Index, losing some traction, down by 0.09%, below the 110.000 mark. At the same time, the US 10-year benchmark note rate shows signs of exhaustion, flat at around 3.414%.

Another tailwind for the white metal prices was that the US 10-year TIPS, a proxy for real yields, gained only one bps, sitting at 0.939%.

On Thursday, the US economic docket will feature unemployment claims, retail sales, and the New York and Philadelphia Fed Manufacturing Indices, a prelude for October’s ISM report.

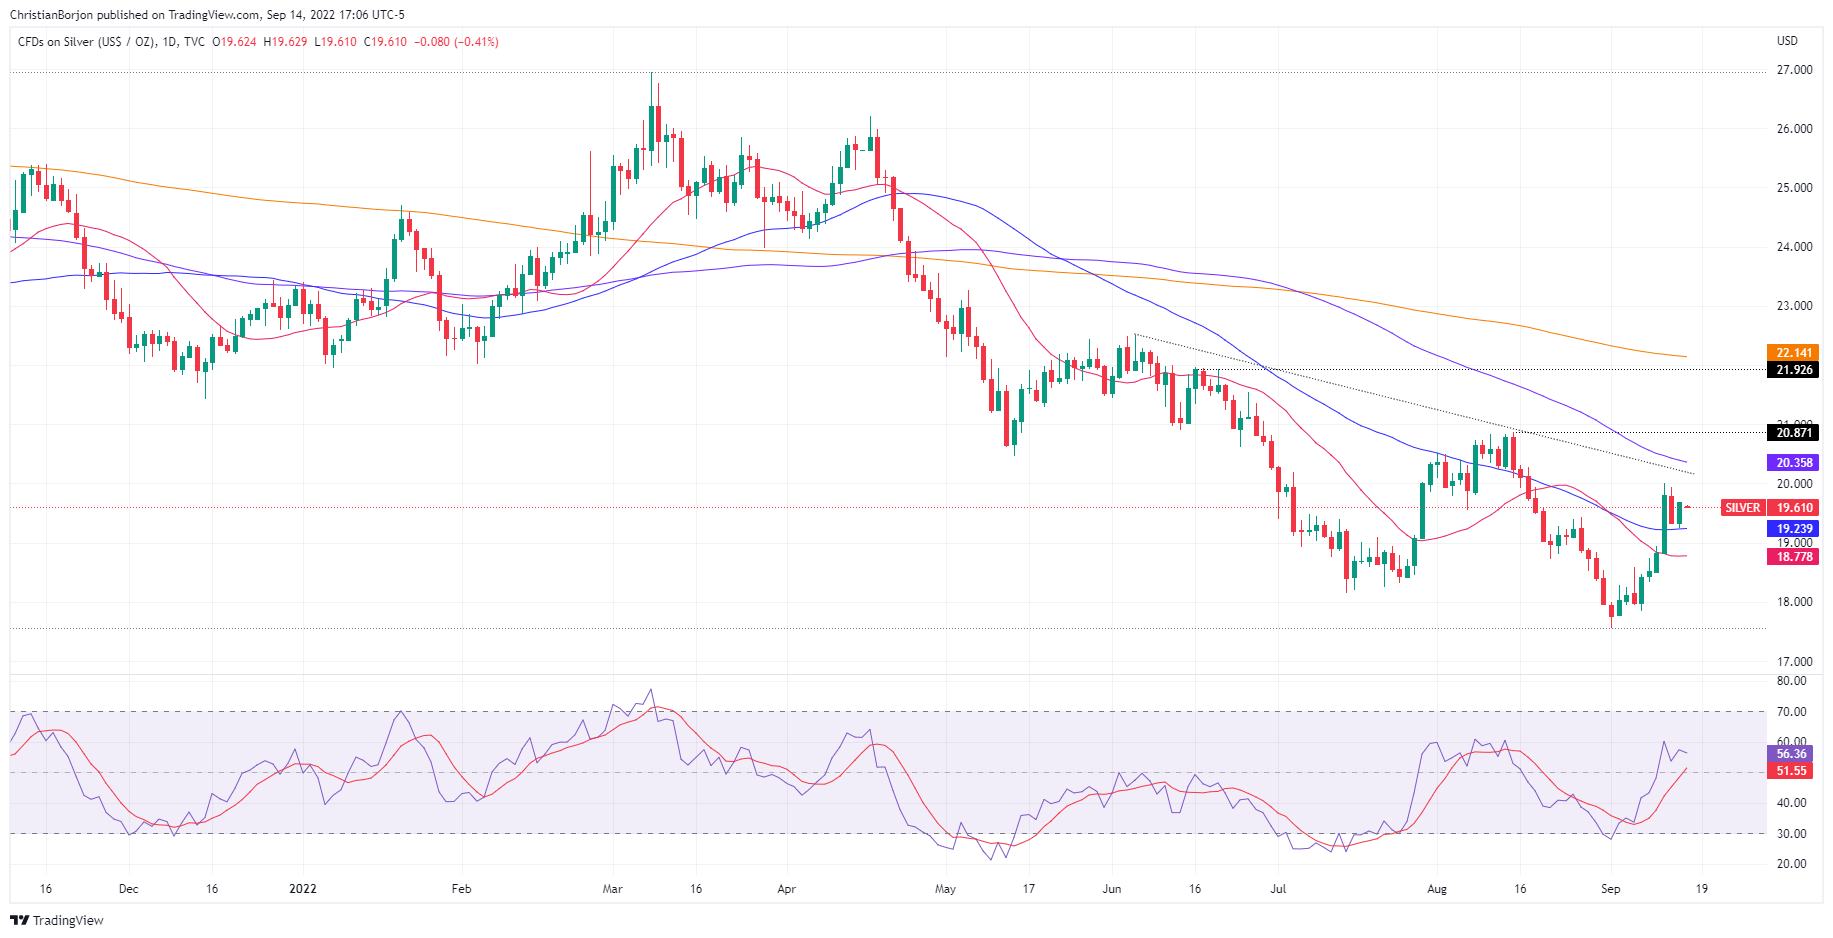
Silver Price Analysis (XAG/USD): Technical outlook

The XAG/USD daily chart illustrates the white metal as neutral-to-downward biased. However, if silver buyers reclaim the $20.00 mark, that could pave the way for a test of a four-month-old downslope trendline around $20.20 before reaching the 100-day EMA at $20.39. A breach of the latter will expose the August 15 cycle high at $20.87, ahead of the $21.00 psychological level.

XAG/USD

Overview
Today last price19.61
Today Daily Change0.30
Today Daily Change %1.55
Today daily open19.33
 
Trends
Daily SMA2018.8
Daily SMA5019.24
Daily SMA10020.45
Daily SMA20022.17
 
Levels
Previous Daily High19.95
Previous Daily Low19.33
Previous Weekly High18.95
Previous Weekly Low17.85
Previous Monthly High20.88
Previous Monthly Low17.94
Daily Fibonacci 38.2%19.57
Daily Fibonacci 61.8%19.71
Daily Pivot Point S119.13
Daily Pivot Point S218.92
Daily Pivot Point S318.51
Daily Pivot Point R119.74
Daily Pivot Point R220.15
Daily Pivot Point R320.36

Author

Christian Borjon Valencia

Christian Borjon began his career as a retail trader in 2010, mainly focused on technical analysis and strategies around it. He started as a swing trader, as he used to work in another industry unrelated to the financial markets.

More from Christian Borjon Valencia
Share:

Markets move fast. We move first.

Orange Juice Newsletter brings you expert driven insights - not headlines. Every day on your inbox.

By subscribing you agree to our Terms and conditions.

Editor's Picks

EUR/USD bounces toward 1.1750 as US Dollar loses strength

EUR/USD returned to the 1.1750 price zone in the American session on Friday, despite falling Wall Street, which indicates risk aversion. Trading conditions remain thin following the New Year holiday and ahead of the weekend, with the focus shifting to US employment and European data scheduled for next week.

GBP/USD nears 1.3500, holds within familiar levels

After testing 1.3400 on the last day of 2025, GBP/USD managed to stage a rebound. Nevertheless, the pair finds it difficult to gather momentum and trades with modest intraday gains at around 1.3490 as market participants remain in holiday mood.

Gold trims intraday gains, approaches $4,300

Gold retreated sharply from the $4,400  area and trades flat for the day in the $4,320 price zone. Choppy trading conditions exacerbated the intraday decline, although XAU/USD bearish case is out of the picture, considering growing expectations for a dovish Fed and persistent geopolitical tensions.

Cardano gains early New Year momentum, bulls target falling wedge breakout

Cardano kicks off the New Year on a positive note and is extending gains, trading above $0.36 at the time of writing on Friday. Improving on-chain and derivatives data point to growing bullish interest, while the technical outlook keeps an upside breakout in focus.

Economic outlook 2026-2027 in advanced countries: Solidity test

After a year marked by global economic resilience and ending on a note of optimism, 2026 looks promising and could be a year of solid economic performance. In our baseline scenario, we expect most of the supportive factors at work in 2025 to continue to play a role in 2026.

Crypto market outlook for 2026

Year 2025 was volatile, as crypto often is.  Among positive catalysts were favourable regulatory changes in the U.S., rise of Digital Asset Treasuries (DAT), adoption of AI and tokenization of Real-World-Assets (RWA).