|

Silver Price Analysis: XAG/USD struggles near multi-week low, bearish bias remains

  • Silver oscillates in a narrow band above its lowest level since June 30 set on Monday.
  • The setup remains tilted in favour of bears and supports prospects for further losses.
  • Attempted recovery towards the $23.00 mark could be seen as a selling opportunity.

Silver struggles to capitalize on the previous day's modest bounce from the $22.35 region, or its lowest level since June 30 and oscillates in a narrow band through the early part of the European session on Tuesday. The white metal currently trades just above the mid-$22.00s and remains vulnerable to prolong the recent downward trajectory witnessed over the past four weeks or so.

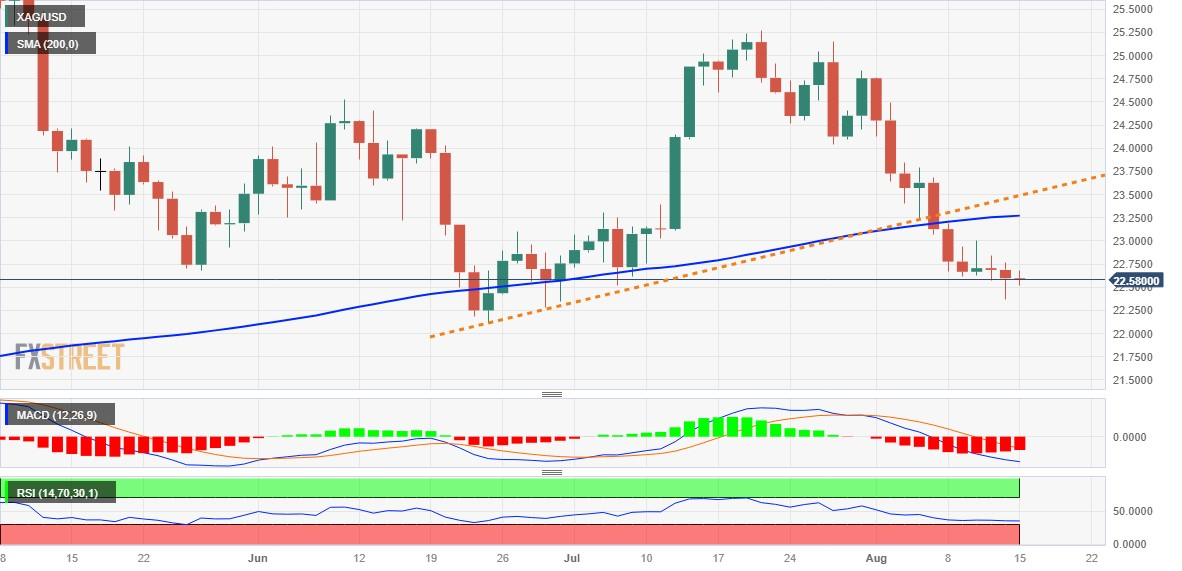
Last week's breakdown through a short-term ascending trend line support extending from the June swing low and a subsequent slide below the very important 200-day Simple Moving Average (SMA) was seen as a fresh trigger for bearish traders. Adding to this, technical indicators on the daily chart are holding deep in the negative territory and are still far from being in the oversold zone. This, along with the lack of any meaningful buying, suggests that the path of least resistance for the XAG/USD is to the downside.

Hence, some follow-through weakness back towards retesting the multi-month low, around the $22.15-$22.10 area touched in June, looks like a distinct possibility. This is closely followed by the $22.00 mark, below which the white metal could accelerate the fall towards the $21.55-$21.50 intermediate support en route to the $21.00 mark. The XAG/USD could extend the slide further towards the $21.00 round figure en route to the YTD low, or levels just below the $20.00 psychological mark touched in March.

On the flip side, attempted recovery is likely to confront some resistance near the overnight swing low, around the $22.75 region, ahead of the $23.00 round figure.  Any subsequent move up might still be seen as a selling opportunity and remain capped near the $23.20-$23.30 confluence support breakpoint, now turned resistance. The latter should act as a pivotal point, which if cleared decisively might trigger a short-covering move and lift the XAG/USD to the $23.60-$23.65 horizontal barrier. Bulls might then aim to reclaim the $24.00 mark.

Silver daily chart

fxsoriginal

Technical levels to watch

XAG/USD

Overview
Today last price22.6
Today Daily Change0.00
Today Daily Change %0.00
Today daily open22.6
 
Trends
Daily SMA2023.93
Daily SMA5023.64
Daily SMA10024.05
Daily SMA20023.26
 
Levels
Previous Daily High22.76
Previous Daily Low22.37
Previous Weekly High23.68
Previous Weekly Low22.58
Previous Monthly High25.27
Previous Monthly Low22.52
Daily Fibonacci 38.2%22.52
Daily Fibonacci 61.8%22.61
Daily Pivot Point S122.39
Daily Pivot Point S222.18
Daily Pivot Point S321.99
Daily Pivot Point R122.79
Daily Pivot Point R222.97
Daily Pivot Point R323.18

Author

Haresh Menghani

Haresh Menghani is a detail-oriented professional with 10+ years of extensive experience in analysing the global financial markets.

More from Haresh Menghani
Share:

Editor's Picks

GBP/USD appears well offered near 1.3160

GBP/USD builds on Tuesday’s losses, although it now manages to pick up some pace and bounce off earlier multi-month troughs near 1.3140. The Greenback’s solid performance and continued political turmoil in the UK are keeping Cable under persistent pressure, with little sign of a meaningful recovery.

EUR/USD rebounds from lows, back to 1.1360

After bottoming out near 1.1320, EUR/USD gathers some traction and reclaims the 1.1350-1.1360 band as the NA session draws to a close on Wednesday. The pair’s drop to multi-month lows comes in response to the continuous leg higher in the US Dollar, which remains propped up by hawkish Fed expectations and uncertainty over the outcome of US-Iran peace negotiations.

Gold pressured near fresh 2026 lows

Gold accelerates its decline and gyrates around the key $4,000 mark per troy ounce on Wednesday, its lowest level since November 2025. In the meantime, tighter-for-longer Fed expectations and a broadly firmer US Dollar continue to weigh on the yellow metal, while uncertainty surrounding a potential US-Iran peace agreement has done little to revive demand for the safe haven space.

XRP nears key support as Fed hike risks suppress demand
Ripple (XRP) continues to face significant selling pressure, trading around $1.05 at the time of writing on Wednesday. This decline mirrors the broader weakness in the crypto market, exacerbated by mounting macroeconomic headwinds and persistent geopolitical uncertainties.
US-Iran talks: The next 60 days will decide where Oil prices go next
Oil markets received some encouraging news after weeks of rising tensions in the Middle East. But let’s not get ahead of ourselves: we’re far from victory, and markets just seem to have priced out the worst-case scenario. The US and Iran have reportedly made "substantive progress" in talks in Switzerland and agreed on a framework for working toward a broader deal within 60 days.
Regime change: Inside Kevin Warsh's first move to make the Fed unreadable on purpose

The rate did not move. That was the least interesting thing about Kevin Warsh's first meeting in charge of the Fed. The FOMC held its benchmark at 3.50%-3.75% for the fourth straight meeting, exactly as priced, and then the new chair used his first press conference to dismantle the machinery the market has leaned on for a decade.