|

Silver Price Analysis: XAG/USD struggles at the 200-DMA and drops below $21.70

  • Silver price clashed with the 200-day EMA and retreated afterward.
  • If XAG/USD dives below $21.50, a test of the YTD low at $21.18 is on the cards.
  • Oscillators turned bearish, opening the door for Silver’s further downside.

Silver price battles at the 200-day Exponential Moving Average (EMA) at $21.93 though it failed to crack the latter and retraced towards Tuesday’s lows as the North American session progressed. Investors awaiting the latest FOMC minutes sought safety in the US Dollar (USD), a headwind for the white metal. At the time of typing, the XAG/USD is trading at $21.62, down 0.70% in the day.

From a daily chart perspective, XAG/USD remains neutral to downward biased, as the white metal stays beneath the important 200-day EMA. Wednesday’s price action remains negative, while the Relative Strength Index (RSI) and the Rate of Change (RoC) indicate that sellers are gathering momentum.

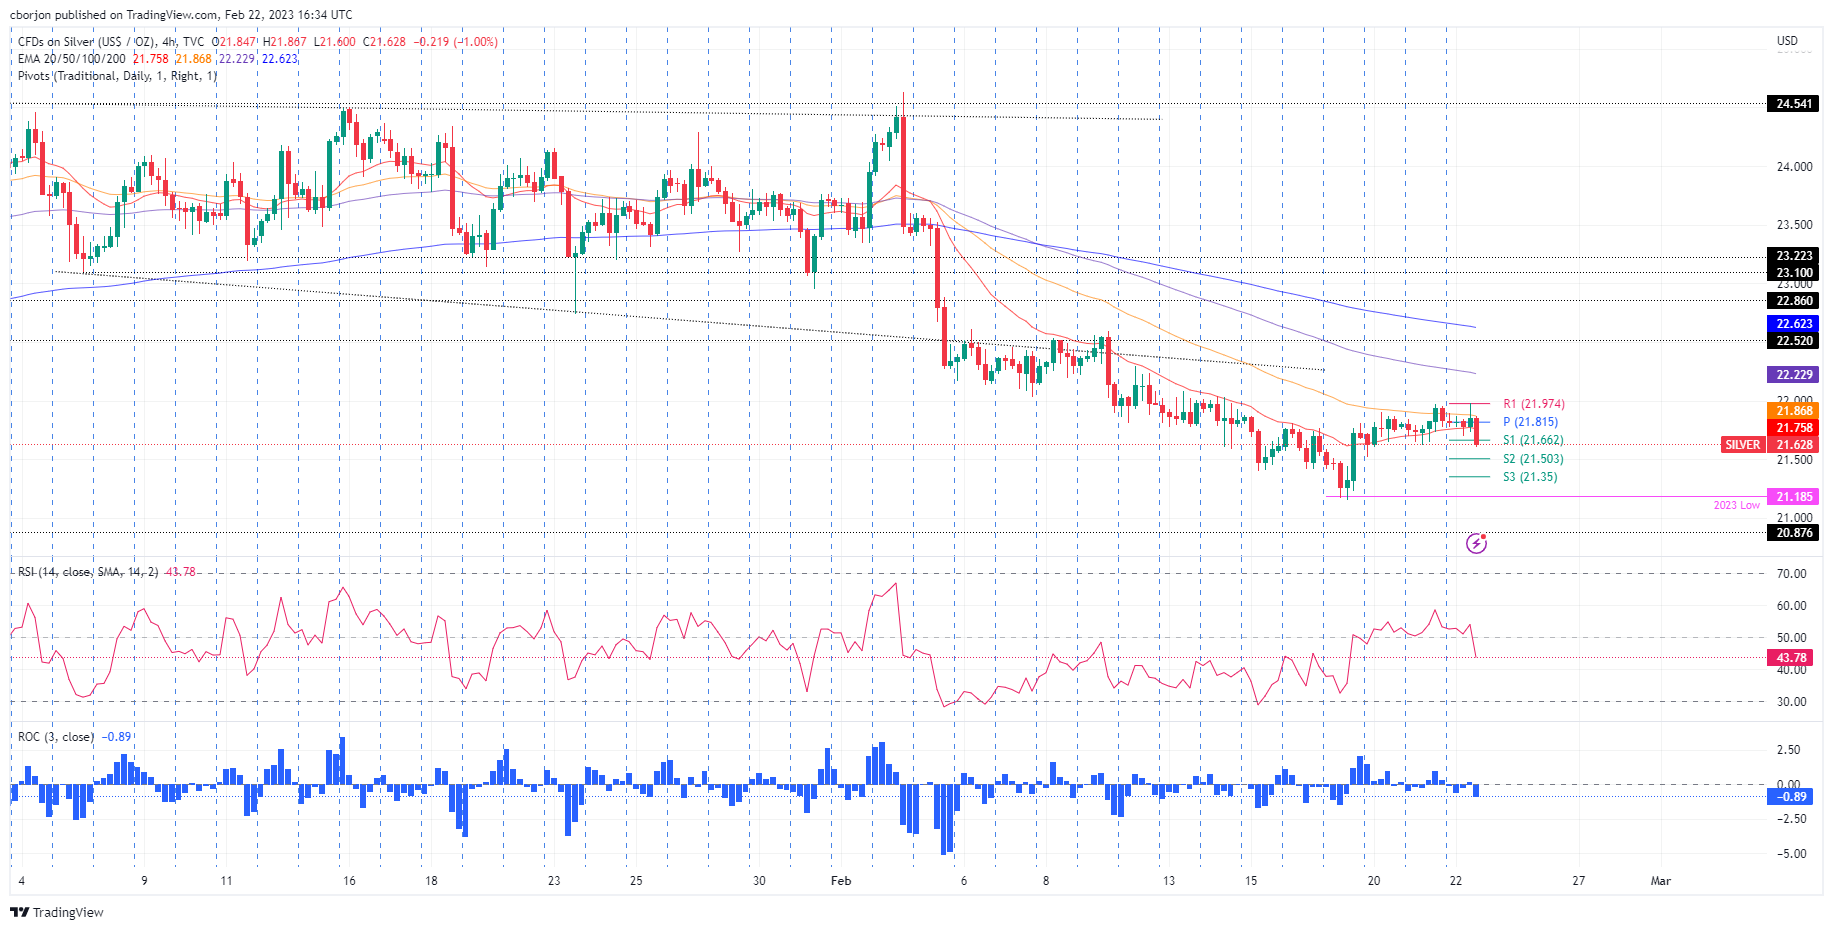
The XAG/USD 4-hour chart portrays the white metal as neutral to downward on an intraday bias. As of typing, Silver has breached the daily pivot point at $21.81, followed by the S1 pivot at $21.66. A bearish continuation is the most probable scenario due to several reasons. The Relative Strength Index (RSI) dived below the 50-mid line, a signal to go short, while the Rate of Change (RoC) is aiming aggressively downwards.

Therefore, the XAG/USD first support would be the S2 pivot point at $21.50. A breach of the latter will expose the S3 daily pivot at $21.35, ahead of the YTD low of $21.18. As an alternate scenario, XAG/USD reclaims the 200-day EMA could pave the way toward $22.00.

XAG/USD 4-hour chart

XAG/USD Key technical levels

XAG/USD

Overview
Today last price21.64
Today Daily Change-0.20
Today Daily Change %-0.92
Today daily open21.84
 
Trends
Daily SMA2022.59
Daily SMA5023.27
Daily SMA10022
Daily SMA20021.02
 
Levels
Previous Daily High21.98
Previous Daily Low21.65
Previous Weekly High22.08
Previous Weekly Low21.18
Previous Monthly High24.55
Previous Monthly Low22.76
Daily Fibonacci 38.2%21.85
Daily Fibonacci 61.8%21.77
Daily Pivot Point S121.67
Daily Pivot Point S221.49
Daily Pivot Point S321.34
Daily Pivot Point R122
Daily Pivot Point R222.15
Daily Pivot Point R322.33

Author

Christian Borjon Valencia

Christian Borjon began his career as a retail trader in 2010, mainly focused on technical analysis and strategies around it. He started as a swing trader, as he used to work in another industry unrelated to the financial markets.

More from Christian Borjon Valencia
Share:

Markets move fast. We move first.

Orange Juice Newsletter brings you expert driven insights - not headlines. Every day on your inbox.

By subscribing you agree to our Terms and conditions.

Editor's Picks

EUR/USD recovers to 1.1750 region as 2025 draws to a close

Following the bearish action seen in the European session on Wednesday, EUR/USD regains its traction and recovery to the 1.1750 region. Nevertheless, the pair's volatility remains low as trading conditions thin out on the last day of the year.

GBP/USD stays weak near 1.3450 on modest USD recovery

GBP/USD remains under modest beairsh pressure and fluctuates at around 1.3450 on Wednesday. The US Dollar finds fresh demand due to the end-of-the-year position adjustments, weighing on the pair amid the pre-New Year trading lull. 

Gold retreats to $4,300 area, looks to post monthly gains

Gold stays on the back foot on the last day of 2025 and trades near $4,300, possibly pressured by profit-taking and position adjustments. Nevertheless, XAU/USD remains on track to post gains for December and extend its winning streak into a fifth consecutive month.

Bitcoin, Ethereum and XRP prepare for a potential New Year rebound

Bitcoin, Ethereum, and Ripple are holding steady on Wednesday after recording minor gains on the previous day. Technically, Bitcoin could extend gains within a triangle pattern while Ethereum and Ripple face critical overhead resistance. 

Economic outlook 2026-2027 in advanced countries: Solidity test

After a year marked by global economic resilience and ending on a note of optimism, 2026 looks promising and could be a year of solid economic performance. In our baseline scenario, we expect most of the supportive factors at work in 2025 to continue to play a role in 2026.

Crypto market outlook for 2026

Year 2025 was volatile, as crypto often is.  Among positive catalysts were favourable regulatory changes in the U.S., rise of Digital Asset Treasuries (DAT), adoption of AI and tokenization of Real-World-Assets (RWA).