|

Silver Price Analysis: XAG/USD seems vulnerable near 38.2% Fibo., lowest since April

  • Silver consolidates the overnight slide to its lowest level since early April.
  • The setup favours bearish traders and supports prospects for further losses.
  • Any attempted recovery is likely to remain capped near the $24.25-30 area.

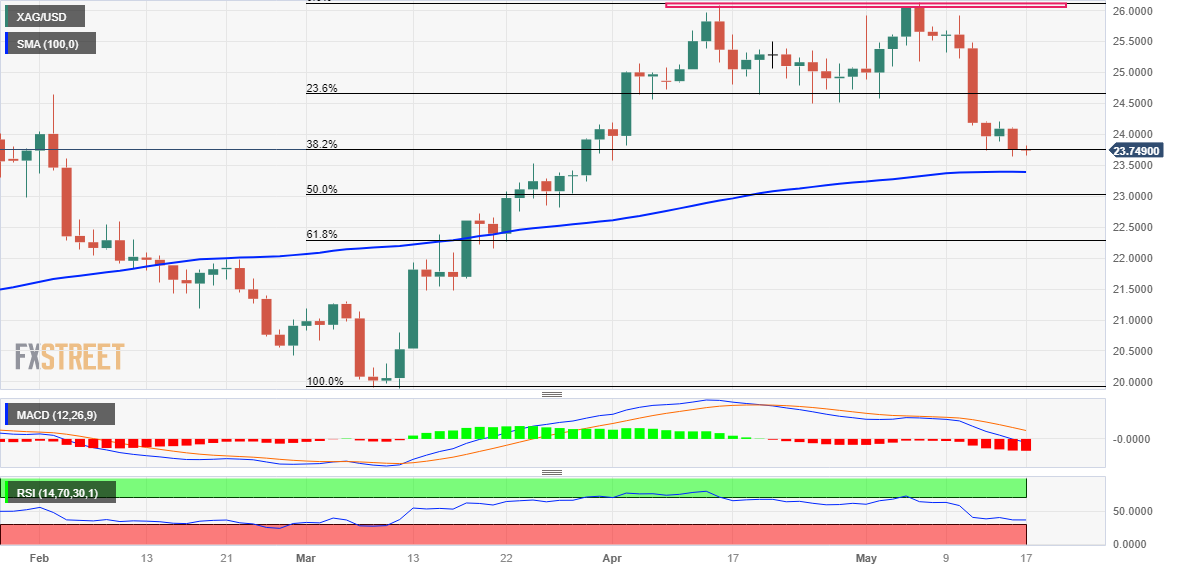
Silver enters a bearish consolidation phase on Wednesday and oscillates in a narrow trading band around the $23.70-$23.75 area, just above its lowest level since April 3 touched the previous day.

From a technical perspective, the aforementioned area represents the 38.2% Fibonacci retracement level of the March-May rise. Some follow-through selling will expose the 100-day Simple Moving Average (SMA), currently pegged around the $23.40-$23.35 region, below which the XAG/USD could slide towards 50% Fibo. level, around the $23.00 round-figure mark.

Some follow-through selling below the latter will be seen as a fresh trigger for bearish traders and set the stage for an extension of the recent sharp pullback from over a one-year top touched earlier this month. The XAG/USD might then accelerate the fall towards the $22.65-$22.60 intermediate support before dropping to the $22.30-$22.25 zone, or the 61.8% Fibo. level.

Meanwhile, oscillators on the daily chart are holding deep in the negative territory and are still far from being in the oversold zone. Hence, any attempted recovery back above the $24.00 mark is more likely to attract fresh sellers and remain capped near the $24.25-$24.30 supply zone. That said, some follow-through buying might prompt an aggressive short-covering rally.

The XAG/USD might then surpass the 23.6% Fibo. level, around the $24.60 zone, aim to reclaim the $25.00 psychological mark. The momentum could get extended further towards the $25.30-$25.40 supply zone en route to the $26.00 round figure and the YTD peak, around the $26.10-$26.15 region.

Silver daily chart

fxsoriginal

Key levels to watch

XAG/USD

Overview
Today last price23.73
Today Daily Change-0.03
Today Daily Change %-0.13
Today daily open23.76
 
Trends
Daily SMA2025.05
Daily SMA5023.98
Daily SMA10023.4
Daily SMA20021.89
 
Levels
Previous Daily High24.11
Previous Daily Low23.64
Previous Weekly High25.92
Previous Weekly Low23.74
Previous Monthly High26.09
Previous Monthly Low23.57
Daily Fibonacci 38.2%23.82
Daily Fibonacci 61.8%23.93
Daily Pivot Point S123.56
Daily Pivot Point S223.36
Daily Pivot Point S323.09
Daily Pivot Point R124.03
Daily Pivot Point R224.3
Daily Pivot Point R324.5

Author

Haresh Menghani

Haresh Menghani is a detail-oriented professional with 10+ years of extensive experience in analysing the global financial markets.

More from Haresh Menghani
Share:

Editor's Picks

EUR/USD drops below 1.1600 on broad USD strength

EUR/USD stays under bearish pressure and trades at a fresh six-week low below 1.1600 on Tuesday. Despite stronger-than-forecast inflation data from the Eurozone, the pair struggles to stage a rebound as the US Dollar continues to attract safe haven flows amid escalating geopolitical tensions in the Middle East. 

GBP/USD attacks 1.3300, refreshing three-month lows

GBP/USD is deep in the red near 1.3300, accelerating its downside to renew three-month lows in European trading on Tuesday. The ongoing escalation in the Iran war, combined with rising Oil prices, weighs negatively on the higher-yielding Pound Sterling as the US Dollar capitalizes on increased haven demand.

Gold drops below $5,200 on stronger USD, rallying US yields

Gold attracts some intraday selling and falls below $5,200 on Tuesday. The US Dollar climbs to a fresh high since January 20 and turns out to be a key factor exerting downward pressure on the commodity. Meanwhile, the benchmark 10-year US Treasury bond yield rises nearly 2% on the day, putting additional weight on XAU/USD's shoulders.

Crypto Today: Bitcoin, Ethereum, XRP pull back as sentiment remains in extreme market fear

The cryptocurrency market is broadly in the red on Tuesday as the Middle East grapples with an escalating war. Bitcoin (BTC) is in a pullback, trading below $67,000 at the time of writing, and most altcoins follow suit.

Middle East conflict ramps up a gear as energy price spike rips through markets

It’s another risk off day as geopolitical headwinds continue to batter financial markets. Although markets calmed during the US session and US stocks managed to post gains on Monday, this has not fed through to the European session, and stocks and bonds are sharply lower for a second day.

Hyperliquid Price Forecast: HYPE rises on commodities demand amid US-Iran war

Hyperliquid (HYPE) steadies above $33 at press time on Tuesday, marking its fourth consecutive day of recovery in a broadly volatile market due to the ongoing US-Israel strikes on Iran.