Silver Price Analysis: XAG/USD retreats from one-year peak amid overbought RSI


  • Silver gains strong positive traction on Wednesday and touches a fresh one-year top.
  • The RSI on the daily chart is flashing overbought conditions and capping the upside.
  • The technical setup still supports prospects for a further near-term appreciating move.

Silver catches aggressive bids near the $25.00 psychological mark during the early North American session and spikes to a fresh one-year high in the last hour. The white metal, however, surrenders a major part of its intraday gains and is currently placed around the $25.20-$25.15 area, still up over 0.50% for the day.

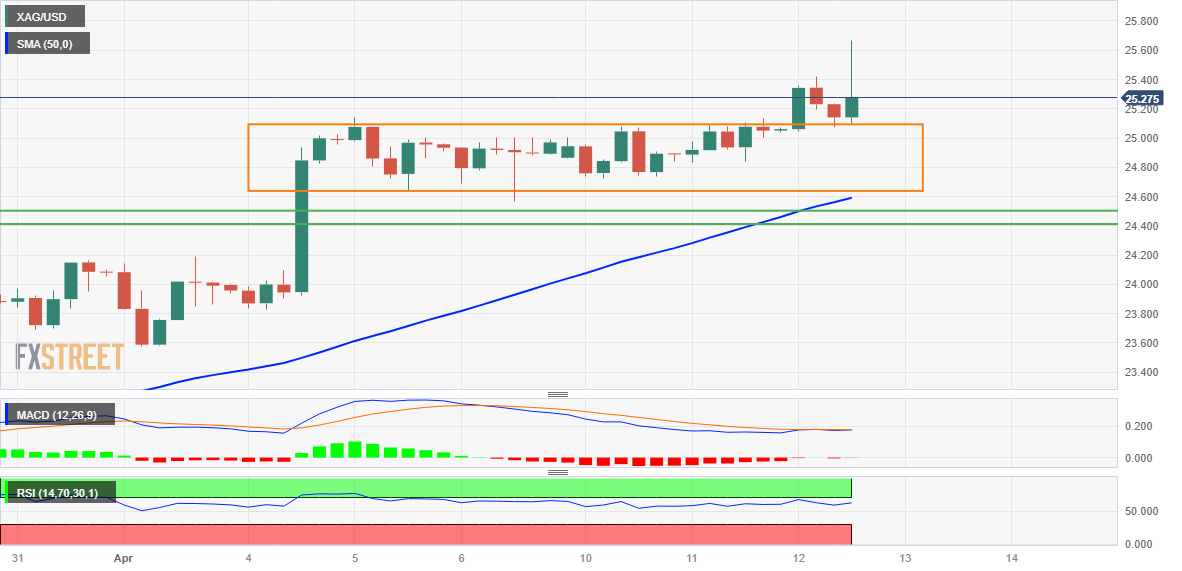
The Relative Strength Index (RSI) on the daily chart is holding above the 70.00 mark and points to extremely overbought conditions. This, in turn, is holding back bullish traders from placing fresh bets around the XAG/USD and keeping a lid on any further gains, at least for the time being. The positive technical setup, however, supports prospects for an extension of the recent appreciating move witnessed over the past month or so.

Sustained strength and acceptance above the $25.00 mark add credence to the near-term positive outlook. Some follow-through buying beyond the daily swing high, around the $25.65 region, will be seen as a fresh trigger for bullish traders and set the stage for a move towards reclaiming the $26.00 mark. The XAG/USD could climb further towards the $26.40-$26.50 intermediate resistance en route to the 2022 top, just ahead of the $27.00 mark.

On the flip side, any meaningful pullback might continue to attract fresh buyers near the $25.00 psychological mark. This should help limit the downside for the XAG/USD near the $24.30-$24.40 resistance breakpoint, now turned support. That said, a convincing break below could make the commodity vulnerable to weaken below the $24.00 mark and test the $23.60-$23.55 support before dropping to the $23.15 zone en route to the $23.00 mark.

Silver 4-hour chart

fxsoriginal

Key levels to watch

XAG/USD

Overview
Today last price 25.45
Today Daily Change 0.40
Today Daily Change % 1.60
Today daily open 25.05
 
Trends
Daily SMA20 23.43
Daily SMA50 22.34
Daily SMA100 22.8
Daily SMA200 21.16
 
Levels
Previous Daily High 25.14
Previous Daily Low 24.84
Previous Weekly High 25.14
Previous Weekly Low 23.57
Previous Monthly High 24.16
Previous Monthly Low 19.9
Daily Fibonacci 38.2% 25.02
Daily Fibonacci 61.8% 24.95
Daily Pivot Point S1 24.88
Daily Pivot Point S2 24.71
Daily Pivot Point S3 24.58
Daily Pivot Point R1 25.18
Daily Pivot Point R2 25.31
Daily Pivot Point R3 25.48


Share: Feed news

Information on these pages contains forward-looking statements that involve risks and uncertainties. Markets and instruments profiled on this page are for informational purposes only and should not in any way come across as a recommendation to buy or sell in these assets. You should do your own thorough research before making any investment decisions. FXStreet does not in any way guarantee that this information is free from mistakes, errors, or material misstatements. It also does not guarantee that this information is of a timely nature. Investing in Open Markets involves a great deal of risk, including the loss of all or a portion of your investment, as well as emotional distress. All risks, losses and costs associated with investing, including total loss of principal, are your responsibility. The views and opinions expressed in this article are those of the authors and do not necessarily reflect the official policy or position of FXStreet nor its advertisers. The author will not be held responsible for information that is found at the end of links posted on this page.

If not otherwise explicitly mentioned in the body of the article, at the time of writing, the author has no position in any stock mentioned in this article and no business relationship with any company mentioned. The author has not received compensation for writing this article, other than from FXStreet.

FXStreet and the author do not provide personalized recommendations. The author makes no representations as to the accuracy, completeness, or suitability of this information. FXStreet and the author will not be liable for any errors, omissions or any losses, injuries or damages arising from this information and its display or use. Errors and omissions excepted.

The author and FXStreet are not registered investment advisors and nothing in this article is intended to be investment advice.

Recommended content


Recommended content

Editors’ Picks

EUR/USD clings to gains above 1.0850 after US inflation data

EUR/USD clings to gains above 1.0850 after US inflation data

EUR/USD trades in positive territory above 1.0850 in the American session on Friday. The US Dollar struggles to preserve its strength following the April PCE inflation data and helps the pair hold its ground heading into the weekend.

EUR/USD News

GBP/USD retreats from 1.2765, holds on to modest gains

GBP/USD retreats from 1.2765, holds on to modest gains

GBP/USD posted a two-day high peat at 1.2765 in the American session, as US data showed that the core PCE inflation held steady at 2.8% on a yearly basis in April. The pair retreated afterwards as risk aversion triggered US Dollar demand.

GBP/USD News

Gold falls towards $2,330 as the mood sours

Gold  falls towards $2,330 as the mood sours

US inflation-related data took its toll on financial markets. Wall Street turned south after the opening and without signs of easing price pressures in the world’s largest economy. The US Dollar takes the lead in a risk-averse environment.

Gold News

Here’s why Chainlink price could crash 15% despite spike in social volume Premium

Here’s why Chainlink price could crash 15% despite spike in social volume

Chainlink price has flashed multiple sell signals after its recent climb, hinting at a short-term correction. This signal comes despite a double-digit growth in its social volume. LINK bulls need to exercise caution as this forecast is backed by on-chain metrics.

Read more

Week ahead – ECB rate cut might get eclipsed by BoC surprise and NFP report

Week ahead – ECB rate cut might get eclipsed by BoC surprise and NFP report

ECB set to slash rates on Thursday, focus on forward guidance. But will the BoC take the lead when it meets on Wednesday? US jobs report eyed on Friday as Fed unyielding on cuts. OPEC+ might extend some output reductions into 2025.

Read more

Forex MAJORS

Cryptocurrencies

Signatures