|

Silver Price Analysis: XAG/USD remains vulnerable, break below 50% Fibo. level awaited

  • Silver regains positive traction on Thursday and reverses a part of the overnight slide.
  • The formation of a rectangle on the daily chart marks a bearish consolidation phase.
  • A sustained break below the 50% Fibo. level will set the stage for a further downfall.

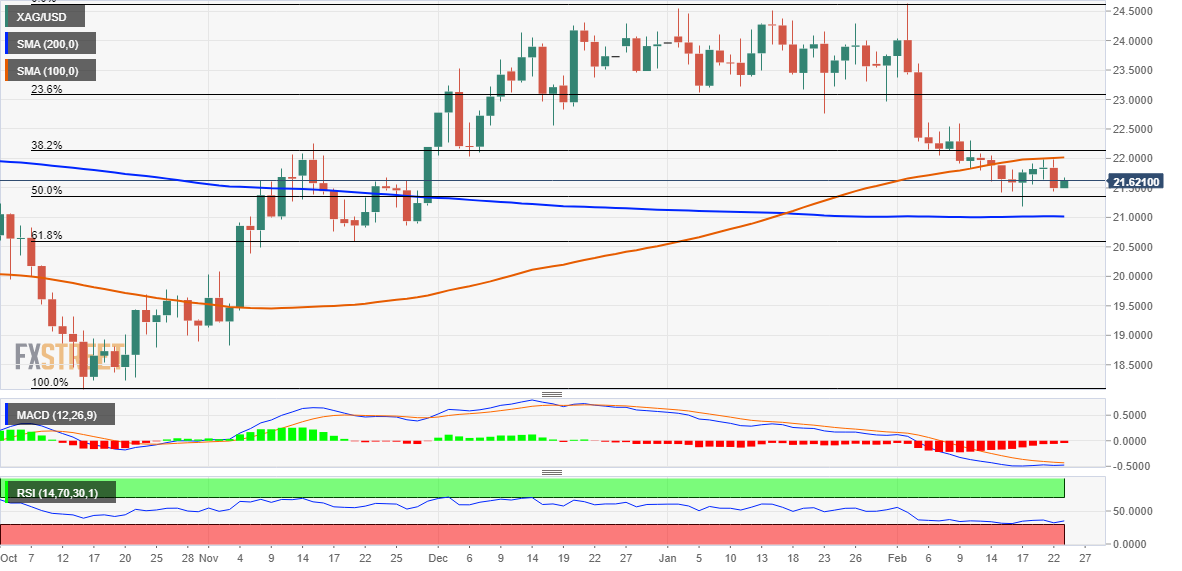
Silver attracts some buyers on Thursday and reverses a part of the previous day's rejection slide from a technically significant 100-day Simple Moving Average (SMA) around the $22.00 mark. The white metal sticks to its gains through the early European session and currently trades around the $21.65-$21.70 area, up around 0.80% for the day.

Looking at the broader picture, the XAG/USD has been oscillating in a familiar range over the past week or so, forming a rectangle on the daily chart. Against the backdrop of the recent pullback from the $24.65 area, or the highest level since April 2022, the rectangle could now be categorized as a bearish consolidation phase. Moreover, oscillators on the daily chart are holding deep in the negative zone and are still far from being in the oversold territory.

The aforementioned technical setup suggests that the path of least resistance for the XAG/USD is to the downside. That said, bearish traders are more likely to wait for a convincing break below the 50% Fibonacci retracement level of the recent rally from October 2022 before placing aggressive bets. Some follow-through selling below the monthly low, around the $22.20-$22.15 area, will reaffirm the negative bias and pave the way for deeper losses.

The XAG/USD might then accelerate the fall towards testing the next relevant support near the $20.60 zone. The downward trajectory could get extended further towards the $20.00 psychological mark and drag the white metal to the $19.75-$19.70 region.

On the flip side, any further move up might continue to confront stiff resistance near the $22.00 mark, or the 100-day SMA. That said, some follow-through buying beyond the 38.2% Fibo. level of the recent rally from October 2022, around the $22.15 zone, could negate the bearish bias. The subsequent short-covering rally might then lift the XAG/USD towards the $22.55-$22.60 supply zone, en route to the 23.6% Fibo. level, around the $23.00 round figure.

Silver daily chart

fxsoriginal

Key levels to watch

XAG/USD

Overview
Today last price21.63
Today Daily Change0.13
Today Daily Change %0.60
Today daily open21.5
 
Trends
Daily SMA2022.47
Daily SMA5023.22
Daily SMA10022.01
Daily SMA20021.02
 
Levels
Previous Daily High21.98
Previous Daily Low21.44
Previous Weekly High22.08
Previous Weekly Low21.18
Previous Monthly High24.55
Previous Monthly Low22.76
Daily Fibonacci 38.2%21.65
Daily Fibonacci 61.8%21.78
Daily Pivot Point S121.3
Daily Pivot Point S221.1
Daily Pivot Point S320.76
Daily Pivot Point R121.84
Daily Pivot Point R222.18
Daily Pivot Point R322.38

Author

Haresh Menghani

Haresh Menghani is a detail-oriented professional with 10+ years of extensive experience in analysing the global financial markets.

More from Haresh Menghani
Share:

Editor's Picks

EUR/USD faces some resistance near 100-SMA on H4, around 1.1830 zone

The EUR/USD pair gains some follow-through positive traction for the second consecutive day and climbs to the 1.1830 region during the Asian session on Thursday. The US Dollar remains on the back foot amid concerns about the economic fallout from US President Donald Trump's erratic trade policies and acts as a tailwind for spot prices.

GBP/USD extends recovery to near 20-day EMA as US Dollar weakens

The Pound Sterling holds onto weekly gains around 1.3565 against the US Dollar during the Asian trading session on Thursday. The GBP/USD pair trades firmly as the US Dollar remains under pressure due to uncertainty surrounding the United States trade policy outlook.

Gold struggle with $5,200 extends ahead of more US-Iran talks

Gold is replicating the recovery moves seen in Wednesday’s Asian trading early Thursday, as buyers continue to flirt with the $5,200 level. Sustained US Dollar weakness and looming US-Iran talks aid the bright metal’s rebound.  

Stellar: Relief bounce fades as bearish undertone persists

Stellar is trading around $0.16 at the time of writing on Thursday after rebounding more than 8% in the previous day. Derivatives data paints a negative picture as XLM’s short bets hit a monthly high while Open Interest continues to decline.

Nvidia delivers another monster earnings report, and forecasts big things to come

It was another monster earnings report from Nvidia for fiscal Q4. Revenues were $68.1bn, smashing estimates of $65bn. Gross profit margin was a healthy 75%, up from 73.5% in the prior quarter, and the outlook for this quarter was monstrous.

Cosmos Hub Price Forecast: ATOM rebounds slightly, bearish outlook remains intact

Cosmos Hub (ATOM) price rebounds, trading above $2.05 at the time of writing on Wednesday, after undergoing a sharp correction since last week. Weakening on-chain and derivatives data support a bearish outlook, while technical analysis remains unfavorable.